| 1.COMPANY OVERVIEW PURE CYCLE CORPORATION Earnings presentation for the three months ended November 30, 2021 FINANCIAL RESULTS |

| 2.SAFE HARBOR STATEMENT Statements that are not historical facts contained or incorporated by reference in this presentation are "forwardlooking statements" ("FLS") within the meaning of the Private Securities Litigation Reform Act of 1995, Section 27A of the Securities Act of 1933 and Section 21C of the Securities Exchange Act of 1934 as amended. FLS involve risks and uncertainties that could cause actual results to differ from projected results. The words "anticipate," "believe," "estimate," "expect," "plan," "intend" and similar expressions, as they relate to us, are intended to identify FLS. Such statements reflect our current views with respect to future events and are subject to certain risks, uncertainties and assumptions. We are not able to predict all factors that may affect future results. We cannot assure you that any of our expectations will be realized. Our actual results could differ materially from those discussed in or implied by these forward-looking statements. Factors that may cause actual results to differ materially from those contemplated by such FLS include, without limitation: the risk factors discussed in our most recent Annual Report on Form 10-K; the timing of new home construction and other development in the areas where we may sell our water, which in turn may be impacted by credit availability; population growth; employment rates; general economic conditions; the market price of water; changes in customer consumption patterns; changes in applicable statutory and regulatory requirements; changes in governmental policies and procedures; uncertainties in the estimation of water available under decrees; uncertainties in the estimation of costs of delivery of water and treatment of wastewater; uncertainties in the estimation of the service life of our systems; uncertainties in the estimation of costs of construction projects; uncertainties in the amount and timing of reimbursable public improvement payments: uncertainty in the single family home rental market and our ability to rent homes in a timely manner or at the amount we project; the strength and financial resources of our competitors; our ability to find and retain skilled personnel; climatic and weather conditions, including flood, droughts and freezing conditions; labor relations; availability and cost of labor, material and equipment; delays in anticipated permit and construction dates; environmental risks and regulations; our ability to raise capital; our ability to negotiate contracts with new customers; and uncertainties in water court rulings; and other factors discussed from time to time in our press releases, public statements and documents filed or furnished with the SEC. Company Overview |
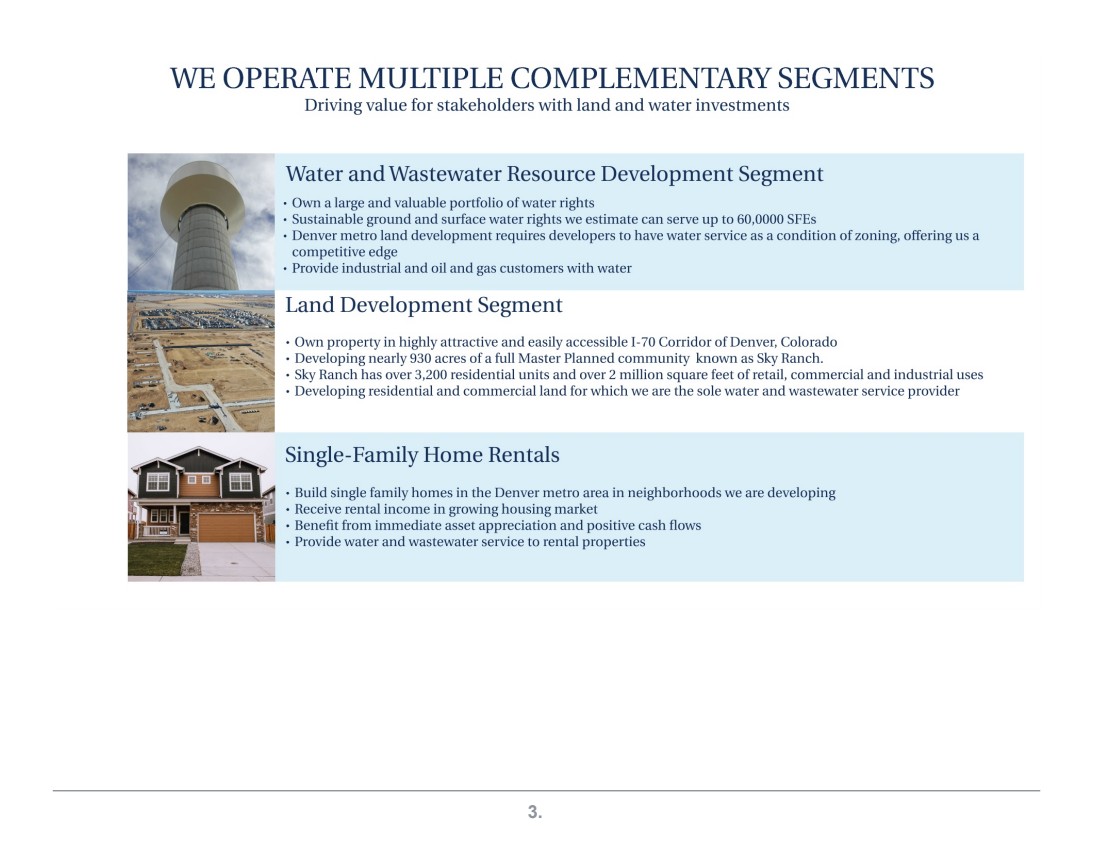
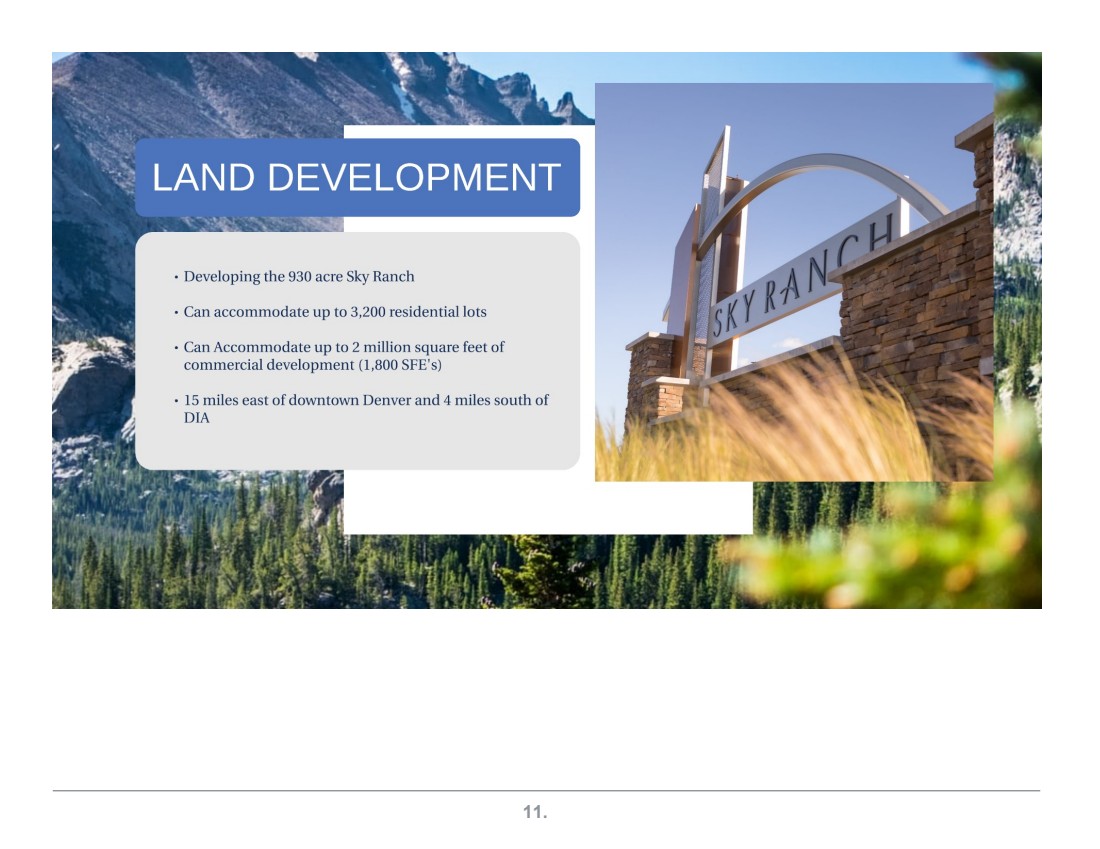
| 3.WE OPERATE MULTIPLE COMPLEMENTARY SEGMENTS Driving value for stakeholders with land and water investments Water and Wastewater Resource Development Segment Own a large and valuable portfolio of water rights Sustainable ground and surface water rights we estimate can serve up to 60,0000 SFEs Denver metro land development requires developers to have water service as a condition of zoning, offering us a competitive edge Provide industrial and oil and gas customers with water Land Development Segment Own property in highly attractive and easily accessible I-70 Corridor of Denver, Colorado Developing nearly 930 acres of a full Master Planned community known as Sky Ranch. Sky Ranch has over 3,200 residential units and over 2 million square feet of retail, commercial and industrial uses Developing residential and commercial land for which we are the sole water and wastewater service provider Single-Family Home Rentals Build single family homes in the Denver metro area in neighborhoods we are developing Receive rental income in growing housing market Benefit from immediate asset appreciation and positive cash flows Provide water and wastewater service to rental properties |
| 4.COMPANY OVERVIEW PURE CYCLE CORPORATION Earnings presentation for the three months ended November 30, 2021 FINANCIAL RESULTS |

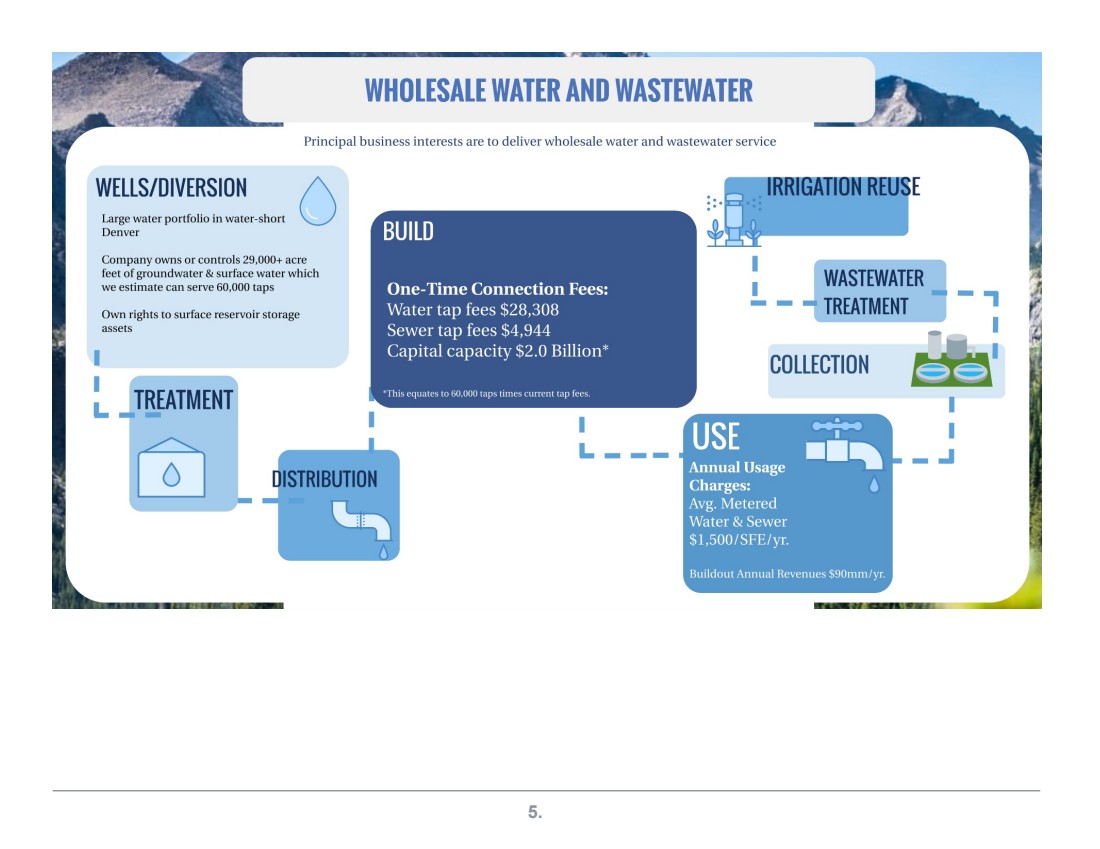
| 5..----------------,...---.:----------=-=-=====::::;:--~------, WHOLESALE WATER AND WASTEWATER Principal business interests are to deliver wholesale water and wastewater service WELLS/DIVERSION Large water portfolio in water-short Denver 0 Company owns or controls 29,000+ acre feet of groundwater & surface water which we estimate can serve 60,000 taps Own rights to surface reservoir storage assets I I L I ISTRIBUTION I L----WASTEWATER TREATMENT COLLECTION I I -J |
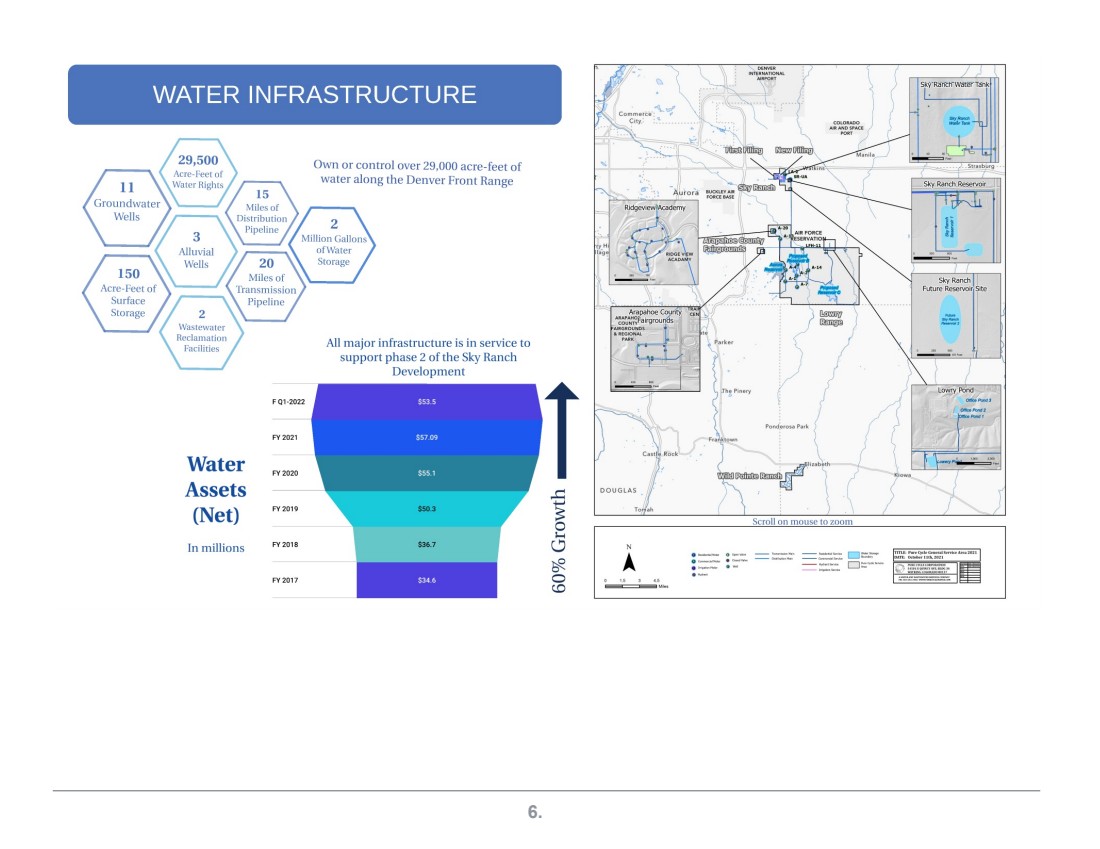
| 6.WATER INFRASTRUCTURE Water Assets (Net) In millions FY 2021 FY 2020 FY 2019 FY 2018 FY 2017 Own or control over 29,000 acre-feet of water along the Denver Front Range All major infrastructure is in service to support phase 2 of the Sky Ranch Development ..c: ~ 0 ~ c., s'2 0 c.o N -o------.... -\ , C0'-0 .. 00 I AIII AND SPACE PORT Scroll on mouse to zoom ml ===□=..=='::. □::--! J |
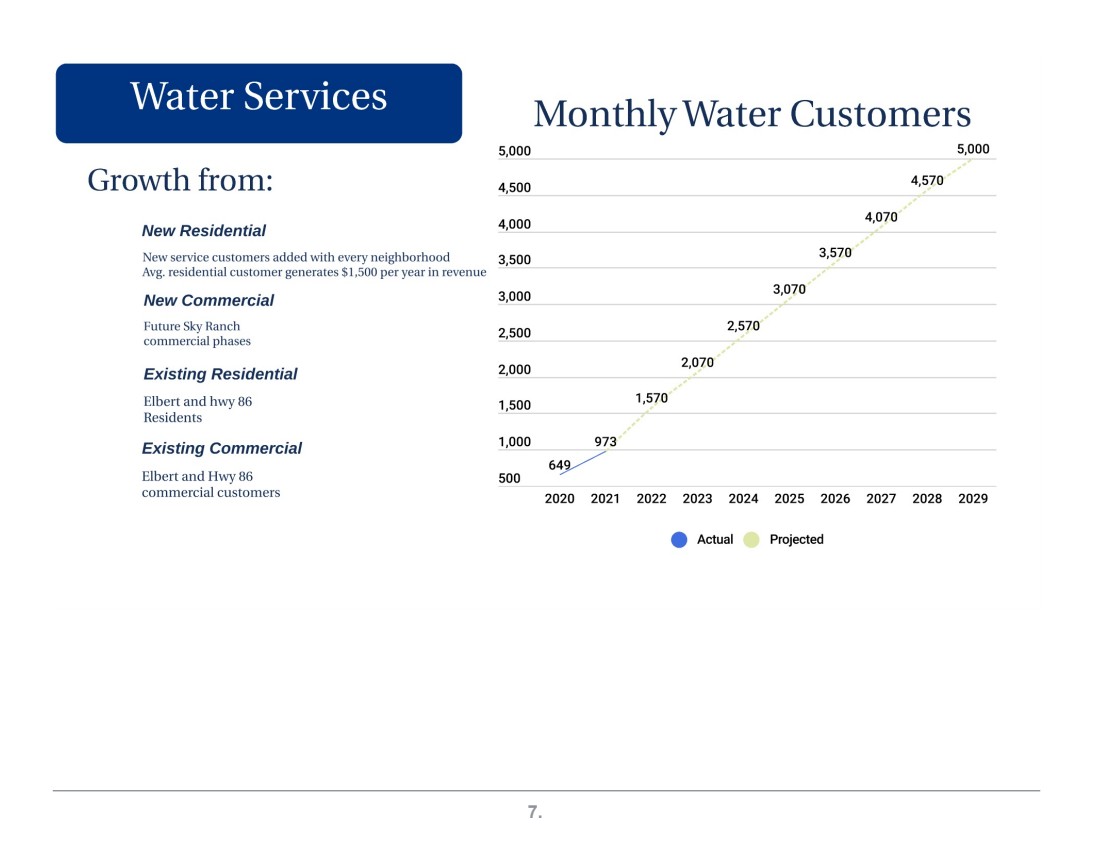
| 7.Water Services Growth from: New Residential New service customers added with every neighborh?od Avg. residential customer generates $1,500 per year m revenue New Commercial Future Sky Ranch commercial phases Existing Residential Elbert and hwy 86 Residents Existing Commercial Elbert and Hwy 86 commercial customers 5,000 4,500 4,000 3,500 3,000 2,500 2,000 1,500 1,000 500 Monthly Water Custolllers 5,000 4,570 4,070 3,570 3,070 2,570 2,070 1,570 973 6.y 2020 2021 2022 2023 2024 2025 2026 2027 2028 2029 Actual Projected |
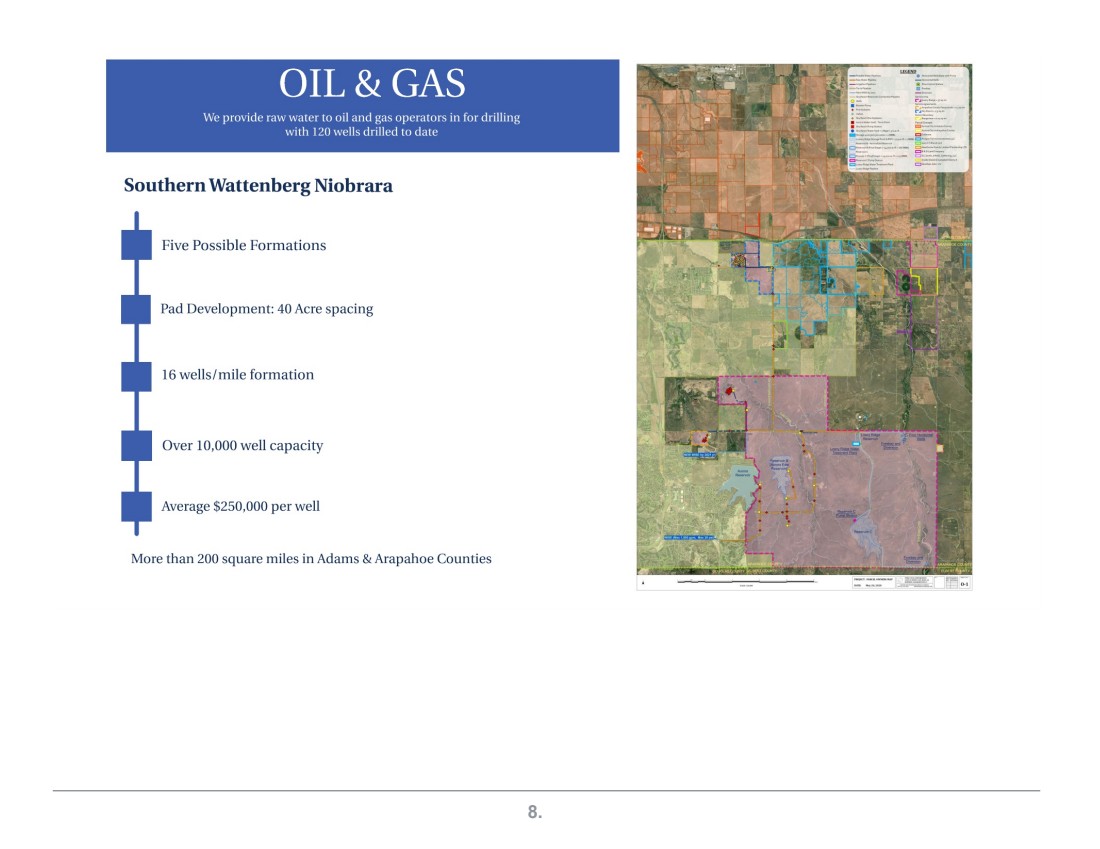
| 8.OIL&GAS We provide raw water to oil and gas operators in for drilling with 120 wells drilled to date Southern Wattenberg Niobrara Five Possible Formations Pad Development: 40 Acre spacing 16 wells/mile formation Over 10,000 well capacity Average $250,000 per well More than 200 square miles in Adams & Arapahoe Counties J.lWI.R.!.==----l!l __ _ ---r'J--•-r-..... --.... ~ --c::J-_____ ..,_..,,_c::J ___ .., . ---=--"-~ ------·--c::,--------... "'"--- ... -~...---... |
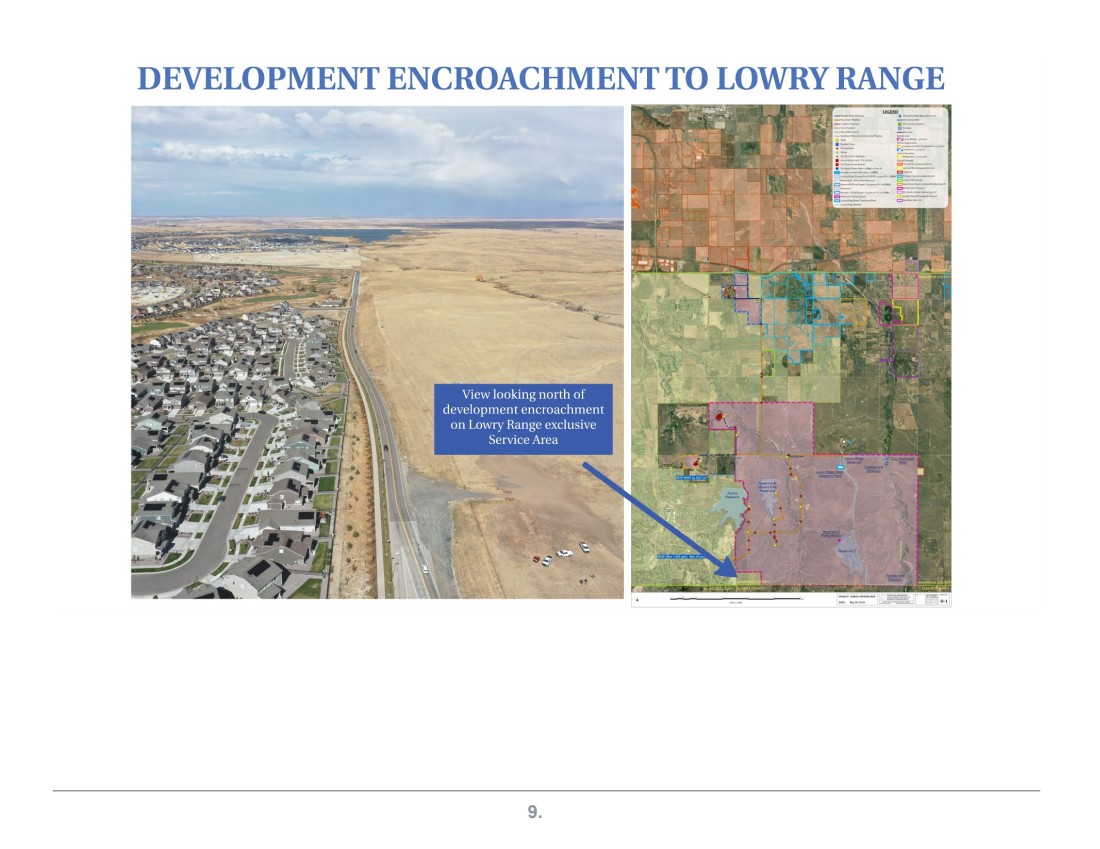
| 9.DEVELOPMENTENCROACHMENTTOLOWRYRANGE -View looking north of development encroachment on Lowry Range exclusive Service Area 111---r-.. ---. -------~ r-..... -.,-a-, .. ----·-.. ,_-:--c-~---· ---c::in.--. g:-.:..:.-..:-.:· -:=:-----. |
| 10.COMPANY OVERVIEW PURE CYCLE CORPORATION Earnings presentation for the three months ended November 30, 2021 FINANCIAL RESULTS |

| 11. Developing the 930 acre Sky Ranch Can accommodate up to 3,200 residential lots Can Accommodate up to 2 million square feet of commercial development (1,800 SFE's) 15 miles east of downtown Denver and 4 miles south of DIA |
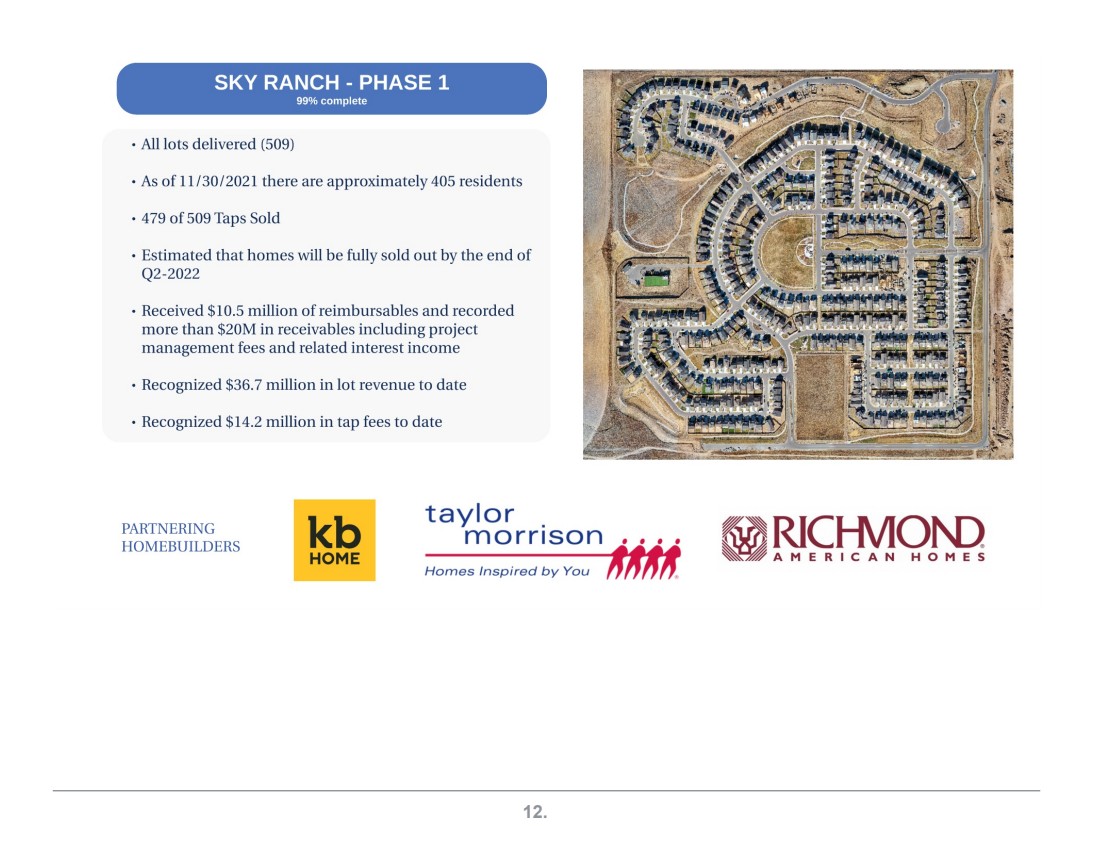
| 12.SKY RANCH -PHASE 1 99% complete All lots delivered (509) As of 11/30/2021 there are approximately 405 residents 4 79 of 509 Taps Sold Estimated that homes will be fully sold out by the end of Q2-2022 Received $10.5 million ofreimbursables and recorded more than $20M in receivables including project management fees and related interest income Recognized $36. 7 million in lot revenue to date Recognized $14.2 million in tap fees to date PARTNERING HOMEBUILDERS kb HOME taylor . morr1son .... Homes Inspired by You HW ~~ RICf-MQN) ~AMERICAN HOMES |
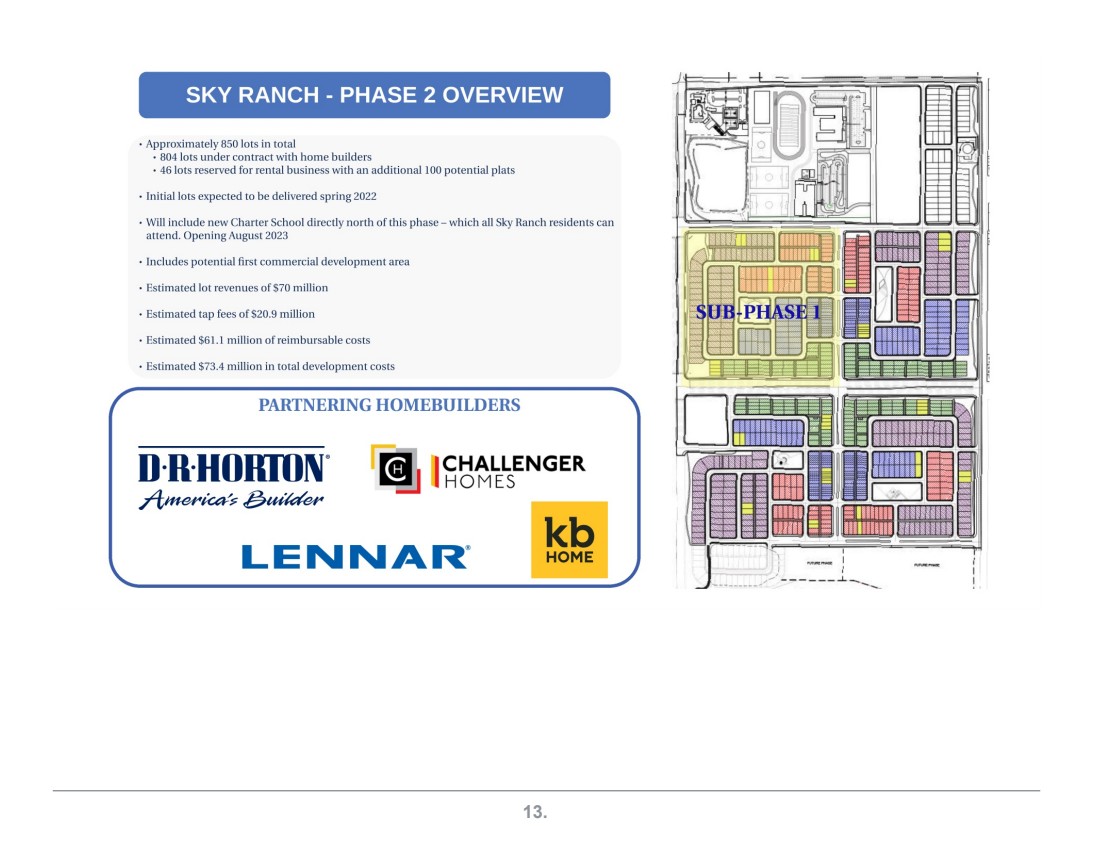
| 13.SKY RANCH -PHASE 2 OVERVIEW Approximately 850 lots in total 804 lots under contract with home builders 46 lots reserved for rental business with an additional 100 potential plats Initial lots expected to be delivered spring 2022 WiU include new Charter School directly north of this phase -which all Sky Ranch residents can attend. Opening August 2023 Includes potential first commercial development area Estimated lot revenues of $70 million Estimated tap fees of$20.9 million Estimated $61.1 million of reimbursable costs Estimated $73.4 mrnion in total development costs PARTNERING HOMEBUILDERS DRHORIDN. ~lea-'~~ CHALLENGER HOMES LENNAR kb HOME ~:..u.:L..L.~~ 8H8 ·.HI .,....,..,..,.._=-:::::te"'l_ .. =,..:._;;;;;;;;;~~~=~~~~~;J ) --1 I ,' ----------~,,,,.-~ -------1..~ |
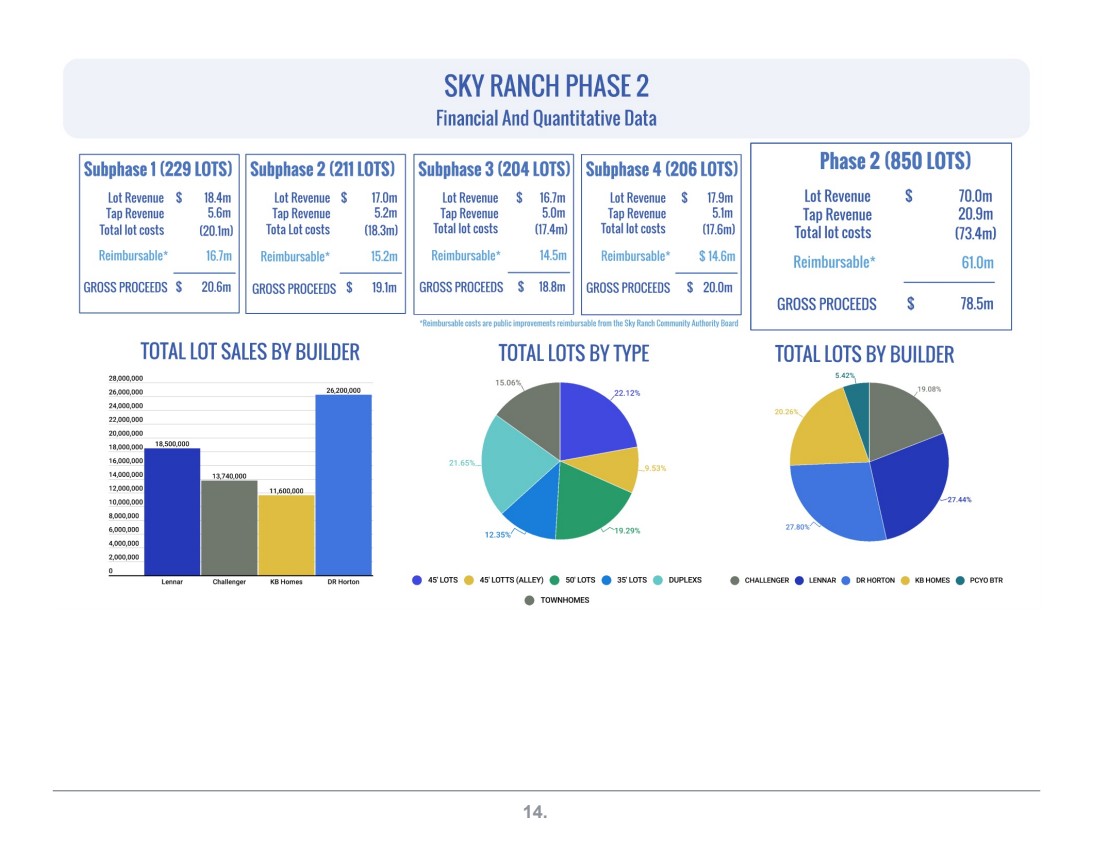
| 14.Subphase 1 (229 LOTS) Subphase 2 (211 LOTS) Lot Revenue $ 18.4m Lot Revenue $ 17.0m Tap Revenue 5.6m Tap Revenue 5.2m Total lot costs (20.1ml Tota Lot costs (18.3ml Reimbursable* 16.7m Reimbursable* 15.2m GROSS PROCEEDS $ 20.6m GROSS PROCEEDS $ 19.lm TOTAL LOT SALES BY BUILDER 28,000,000 26,200,000 Lennar Challenger KB Homes DR Horton SKY RANCH PHASE 2 Financial And Quantitative Data Subphase 3 (204 LOTS) Subphase 4 (206 LOTS) Lot Revenue $ 16.7m Lot Revenue $ 17.9m Tap Revenue 5.0m Tap Revenue 5.lm Total lot costs (17.4ml Total lot costs (17.6ml Reimbursable* 14.5m Reimbursable* $14.6m GROSS PROCEEDS $ 18.Bm GROSS PROCEEDS $ 20.0m 'Reimbursable costs arc public improvements reimbur.;able from the Sky Ranch Community Authority Board TOTAL LOTS BY TYPE Phase 2 (850 LOTS) Lot Revenue Tap Revenue Total lot costs Reimbursable* GROSS PROCEEDS TOTAL LOTS BY BUILDER 70.0m 20.9m 03.4m) 61.0m 78.5m 45' LOTS 45' LOTTS (ALLEY) 50' LOTS 35' LOTS DUPLEXS TOWNHOMES CHALLENGER LENNAR DR HORTON KB HOMES PCYO BTR |
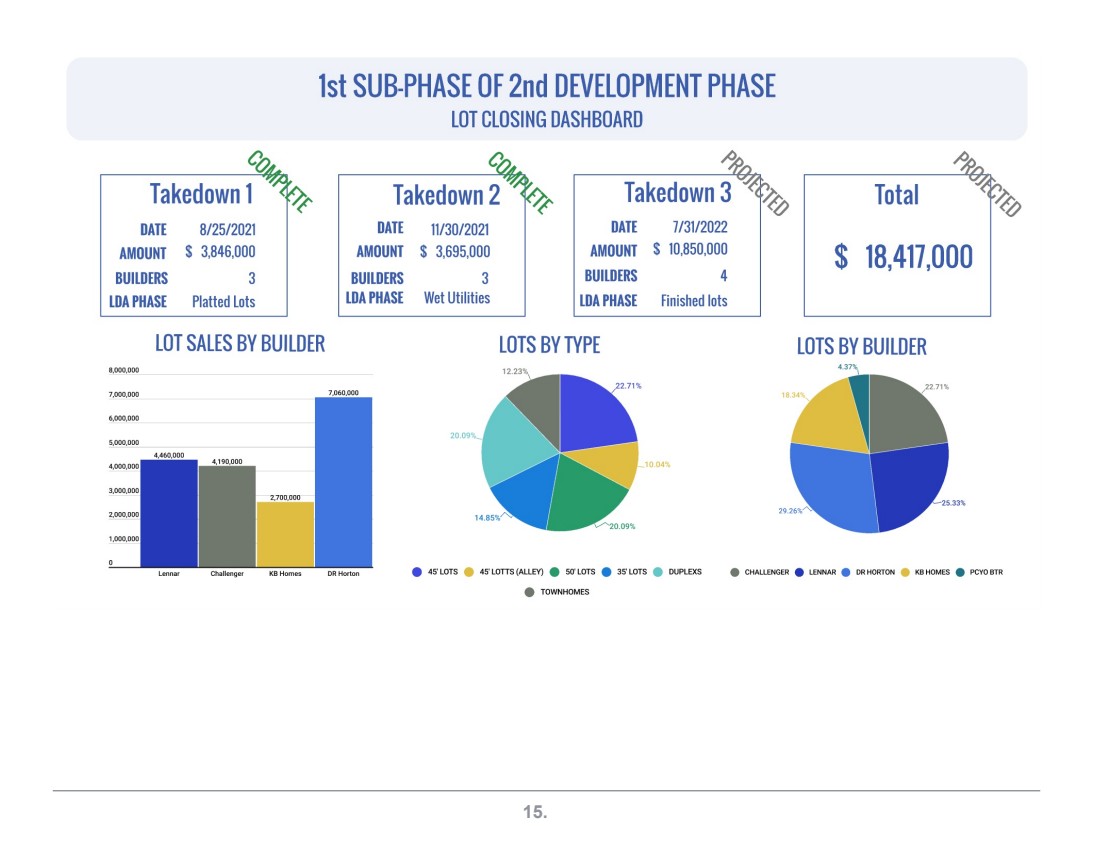
| 15.Takedown 1 DATE 8/25/2021 AMOUNT $ 3,846,000 BUILDERS 3 LOA PHASE Platted Lots 1st SUB-PHASE OF 2nd DEVELOPMENT PHASE LOT CLOSING DASHBOARD CJ Takedown 2 Takedown 3 DATE 11/30/2021 DATE 7/31/2022 AMOUNT $ 3,695,000 AMOUNT $ 10,850,000 BUILDERS 3 BUILDERS 4 LOA PHASE Wet Utilities LOA PHASE Finished lots LOT SALES BY BUILDER LOTS BY TYPE 8,000,000 7,060,000 10.04% Total $ 18,417,000 LOTS BY BUILDER Lennar Challenger KB Homes DR Horton 45' LOTS 45' LOTTS (ALLEY) 50' LOTS 35' LOTS OUPLEXS CHALLENGER LENNAR DR HORTON KB HOMES PCVO BTR TOWNHOMES |
| 16.COMPANY OVERVIEW PURE CYCLE CORPORATION Earnings presentation for the three months ended November 30, 2021 FINANCIAL RESULTS |
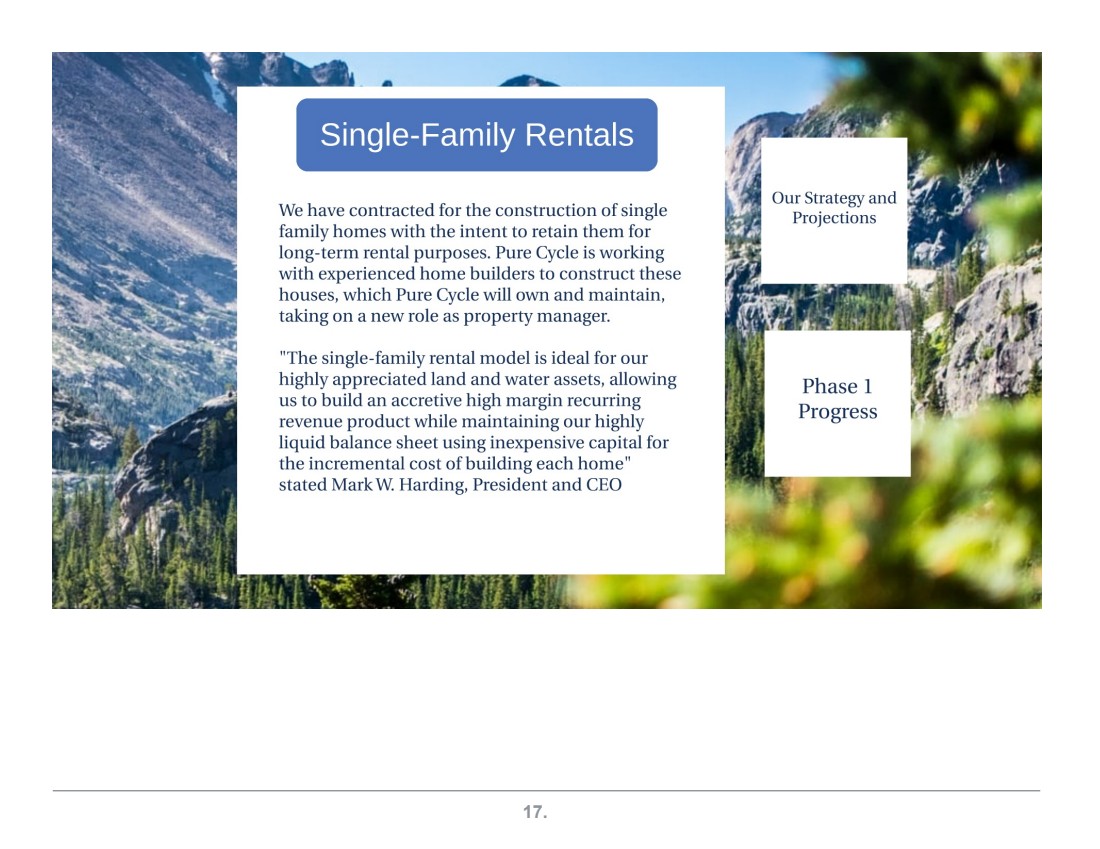
| 17.Single-Family Rentals We have contracted for the construction of single family homes with the intent to retain them for long-term rental purposes. Pure Cycle is working with experienced home builders to construct these houses, which Pure Cycle will own and maintain, taking on a new role as property manager. "The single-family rental model is ideal for our highly appreciated land and water assets, allowing us to build an accretive high margin recurring revenue product while maintaining our highly liquid balance sheet using inexpensive capital for the incremental cost of building each home" stated Mark W. Harding, President and CEO Our Strategy and Projections Phase I Progress |
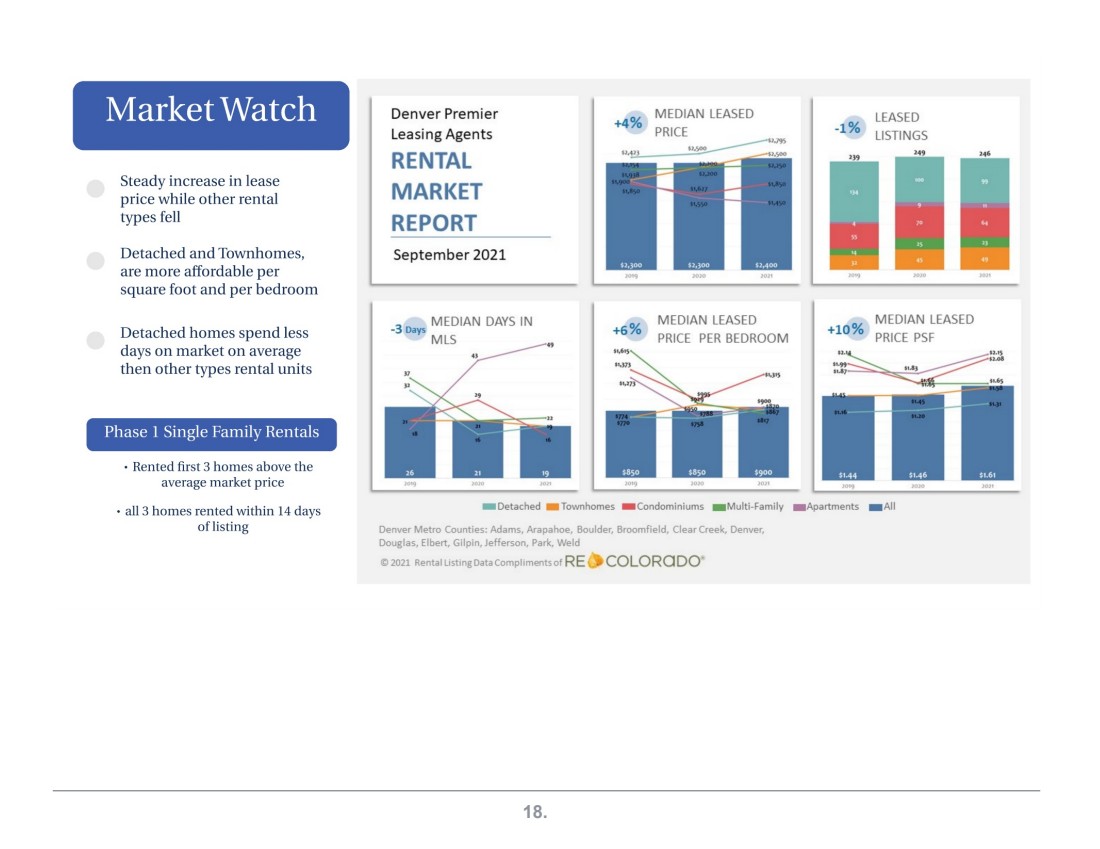
| 18.Market Watch Steady increase in lease price while other rental types fell Detached and Townhomes, are more affordable per square foot and per bedroom Detached homes spend less days on market on average then other types rental units Phase I Single Family Rentals Rented first 3 homes above the average market price all 3 homes rented within 14 days oflisting Denver Premier +4% MEDIAN LEASED LEASED Leasing Agents PRICE -1% LISTINGS Sl,J'IJS RENTAL Sl..41'3 n.sc,o, u.soo 239 J49 MARKET REPORT September 2021 1019 ,.,. 3 MEDIAN DAYS IN +6% MEDIAN LEASED +10% MEDIAN LEASED -Days PRICE PER BEDROOM PRICE PSF MLS ., )7 -Detached Townhomes -Condominiums Multi-Family Apartments All Denver Metro Counties: Adams, Arapahoe, Boulder, Broomfield, Clear Creek, Denver, Douglas, Elbert, Gilpin, Jefferson, Parl<, Weld 2021 Rental Listing Data Compliments of RE CQLQRO DO 246 ,.,, |
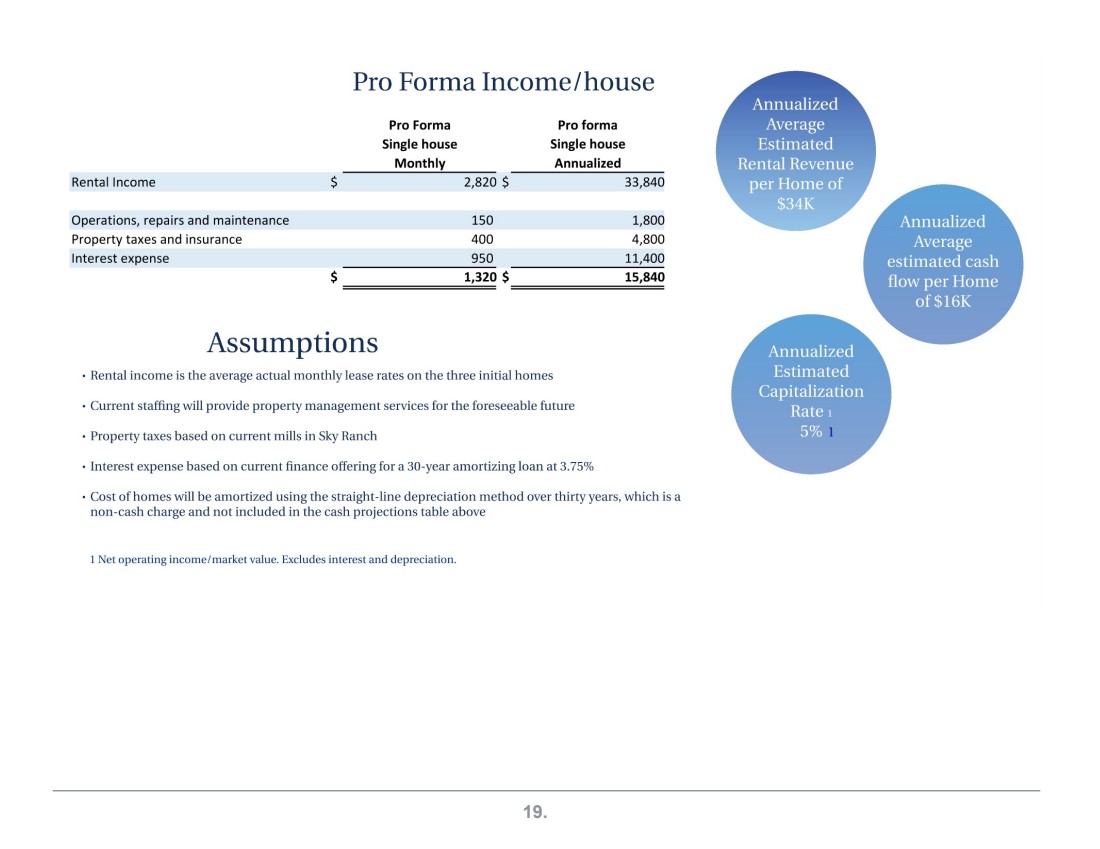
| 19.Pro Forma Income/house Rental Income Operations, repairs and maintenance Property taxes and insurance Interest expense $ $ Assumptions Pro Forma Single house Monthly 2,820 $ Proforma Single house Annualized 33,840 150 1,800 400 4,800 950 11,400 1,320 $ 15,840 ========== Rental income is the average actual monthly lease rates on the three initial homes Current staffing will provide property management services for the foreseeable future Property taxes based on current mills in Sky Ranch Interest expense based on current finance offering for a 30-year amortizing loan at 3. 75% Cost of homes will be amortized using the straight-line depreciation method over thirty years, which is a non-cash charge and not included in the cash projections table above 1 Net operating income/market value. Excludes interest and depreciation. |
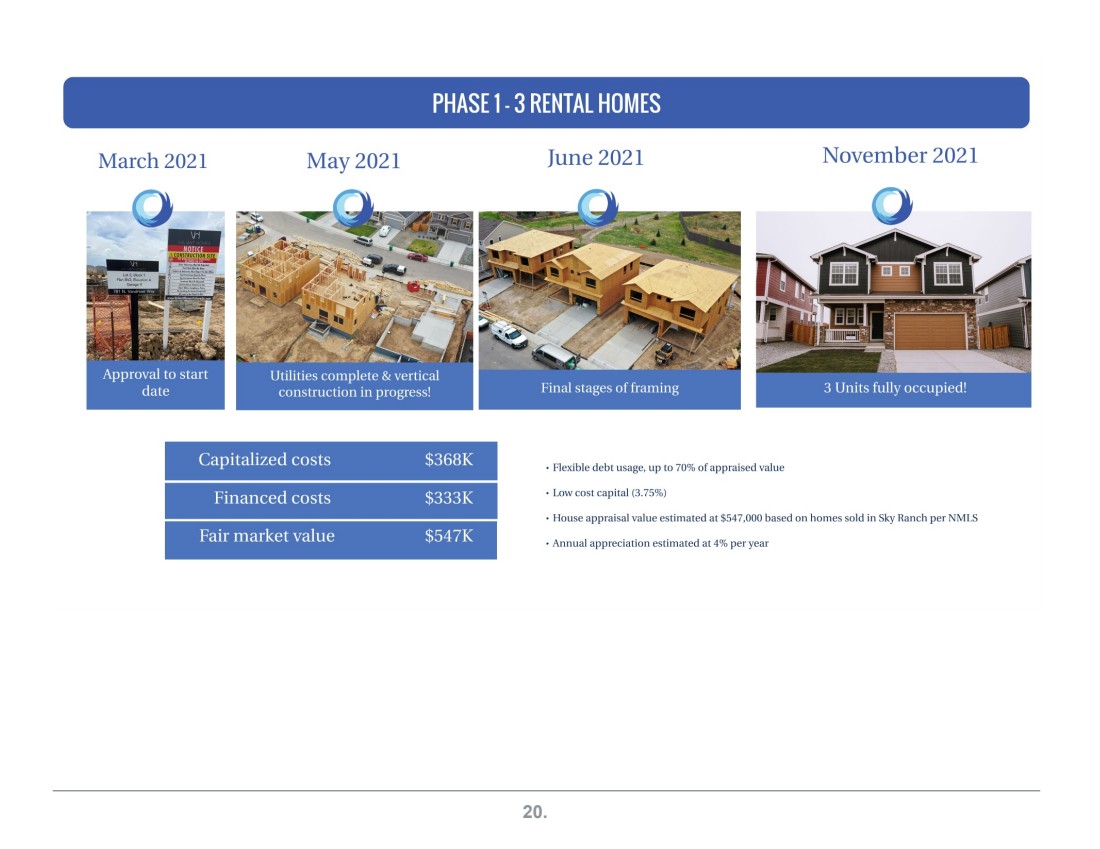
| 20.PHASE 1-3 RENTAL HOMES March 2021 May 2021 Capitalized costs $368K Financed costs $333K Fair market value $547K June 2021 Flexible debt usage, up to 70% of appraised value Low cost capital (3. 75%) November 2021 House appraisal value estimated at $547,000 based on homes sold in Sky Ranch per MLS Annual appreciation estimated at 4% per year |
| 21.COMPANY OVERVIEW PURE CYCLE CORPORATION Earnings presentation for the three months ended November 30, 2021 FINANCIAL RESULTS |

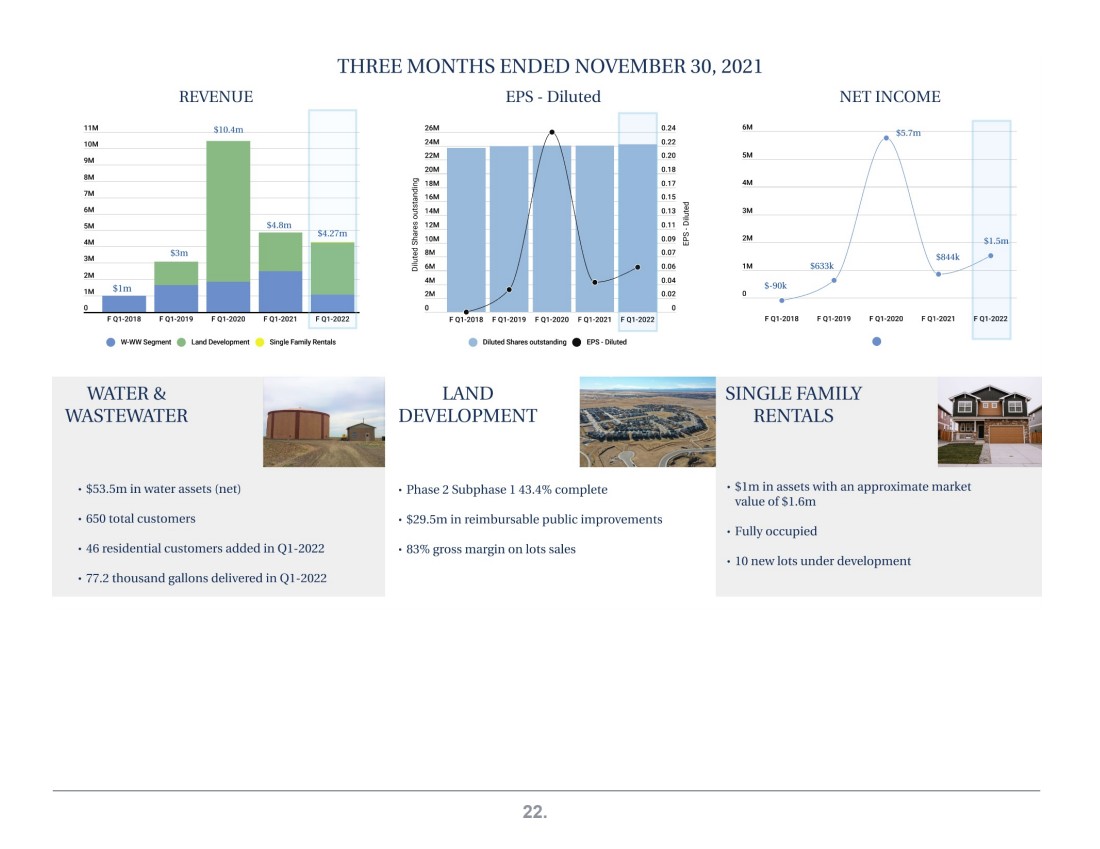
| 22.REVENUE THREE MONTHS ENDED NOVEMBER 30, 2021 EPS -Diluted NET INCOME 11M $10.4m 10M 9M 8M 7M 6M -SM $4.8m $4.27m 4M 3M $3m ' 2M i 1M $Im 0 I I F Ql 2018 F Ql 2019 F Ql 2020 F Ql 2021 F Ql 2022 W-WW Segment Land Development Single Family Rentals WATER& WASTEWATER $53.Sm in water assets (net) 650 total customers 46 residential customers added in Ql-2022 77.2 thousand gallons delivered in Ql-2022 26M 24M 22M 20M g, 18M i 16M ~ 14M 0 "' 12M ~ .c: 10M (/) "' 8M ., .;i 6M i5 4M 2M 0 ~ ""'""'----------~--FQ1-2018 FQ12019 FQl-2020 FQl-2021 FQl-2022 Diluted Shares outstanding EPS -Diluted LAND DEVELOPMENT Phase 2 Subphase 1 43.4% complete 0.24 0.22 0.20 0.18 0.17 0.15 0.13 0.11 0.09 0.07 0.06 0.04 0.02 0 $29.Sm in reimbursable public improvements 83% gross margin on lots sales 6M $5.7m SM 4M 3M 2M 1M S633k $-9~ F Ql-2018 F Ql-2019 F Ql-2020 F Ql-2021 F Ql-2022 SINGLE FAMILY RENTALS $lm in assets with an approximate market value of$1.6m Fully occupied 10 new lots under development |
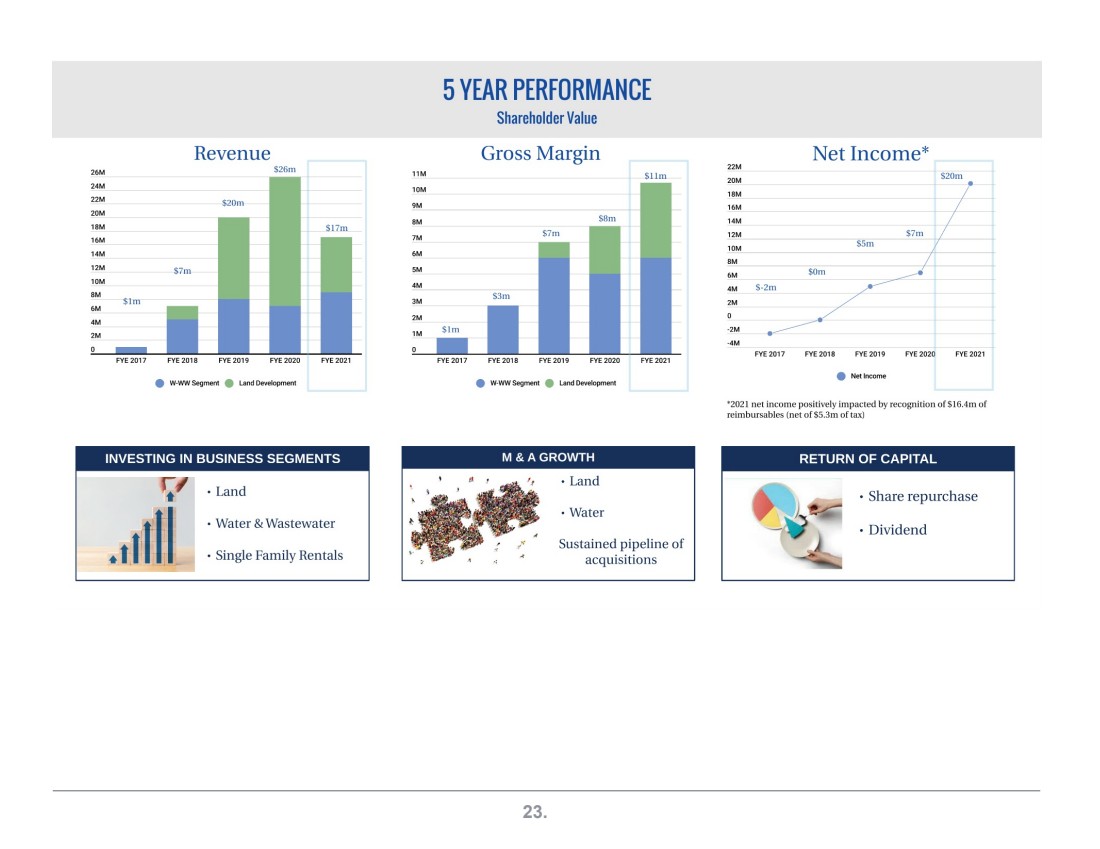
| 23.26M 24M 22M 20M 18M 16M 14M 12M 10M BM 6M 4M 2M Revenue $26m $20m $17m $7m FYE2017 FYE 2018 FYE 2019 FYE 2020 FYE 2021 WWW Segment Land Development INVESTING IN BUSINESS SEGMENTS Land Water & Wastewater Single Family Rentals 11M 10M 9M BM 7M 6M 5M 4M 3M 2M 1M 5 YEAR PERFORMANCE Sim FYE 2017 Shareholder Value Gross Margin $llm $8m $7m $3m FYE 2018 FYE 2019 FYE 2020 FYE 2021 WWW Segment Land Development M &A GROWTH Land Water Sustained pipeline of acquisitions 22M 20M 18M 16M 14M 12M 10M BM 6M 4M 2M 0 -2M -4M Net Income* S20m S-2m j $Om _________. /. ---------- $Sm FYE 2017 FYE 2018 FYE2019 FYE 2020 FYE 2021 Netlncome '2021 net income positively impacted by recognition of$16.4m of reimbursables (net of$5.3m of tax) RETURN OF CAPITAL Share repurchase Dividend |
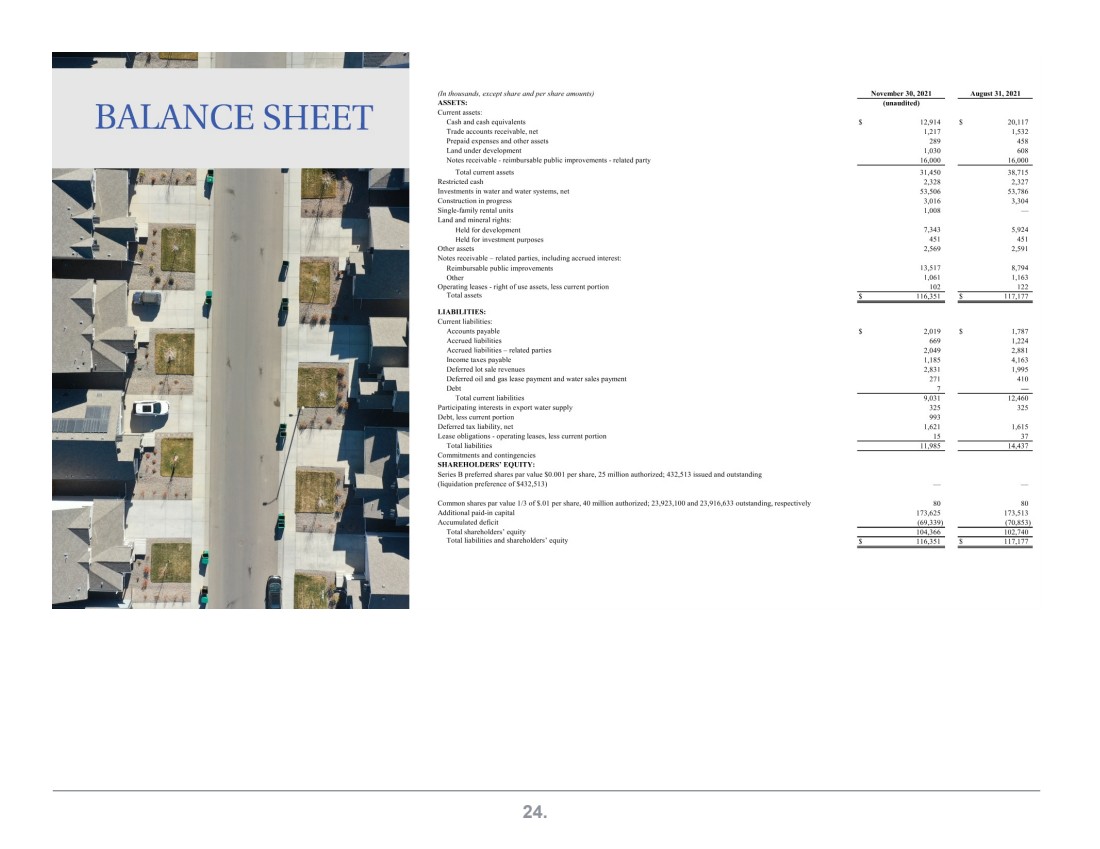
| 24.BALANCE SHEET {In tlw11sa11d~. excepl .\·hare and per .\·hare t1111mmt.~J ASSETS, Current assets: Cash and cash equivalents Trade accounts receivable, net Prepaid expenses and other assets Land under development Notes receivable -reimbursable public improvements -related party Total current assers Restricted cash lnvestmems in water and water systems, net Construcl'ion in progress Single-family ren1al uni1s Land and mineral righ1s: Held for development Held for investment purposes Other assets Notes receivable -related parties, including accrued interest: Reimbursable public improvements Other Operating leases -right of use assets, less current portion Total asset'-LIABILITIES: Current liabilities: Accounts payable Accrued liabilities Accrued liabilities-related parties Income laxes payable Deferred lot sale revenues Deferred oil and gas lease payment and water sales payment Debt Total current liabilities Participating interests in export water supply Debt, less currcnl portion Deferred rnx liability, net Lease obligations -operating leases. less current portion Total liabilities Commitments and contingencies SHAREHOLDERS' EQUITY, Series B preferred shares par value $0,00 I per share, 25 million authorized; 432.513 issued and outstanding (liquidation preference of$432.5 l 3) Common shares par value 1/3 of S.01 per share. 40 million authorized; 23,923.100 and 23,916,633 outstanding. respectively Addit"ional paid-in capital Accumulated deficit Toial shareholders' equity Total liabilities and shareholders' equity Novembc" 30, 2021 August JI, 2021 (unaudited) 12,914 20,117 1,217 1,532 289 458 1,030 608 16,000 16,000 31,450 38,715 2,328 2,327 53.506 53,786 3,016 3,304 1,008 7,343 5,924 451 451 2,569 2.591 13.517 8.794 1,061 1,163 102 122 116.351 117,177 2,019 1,787 669 1,224 2,049 2,881 1,185 4,163 2,831 1,995 271 410 7 9,031 12,460 325 325 993 1,621 1,615 15 37 11,985 14,437 80 80 173,625 173,513 (69,339) (70,853) 104,366 102,740 116.351 117,177 |
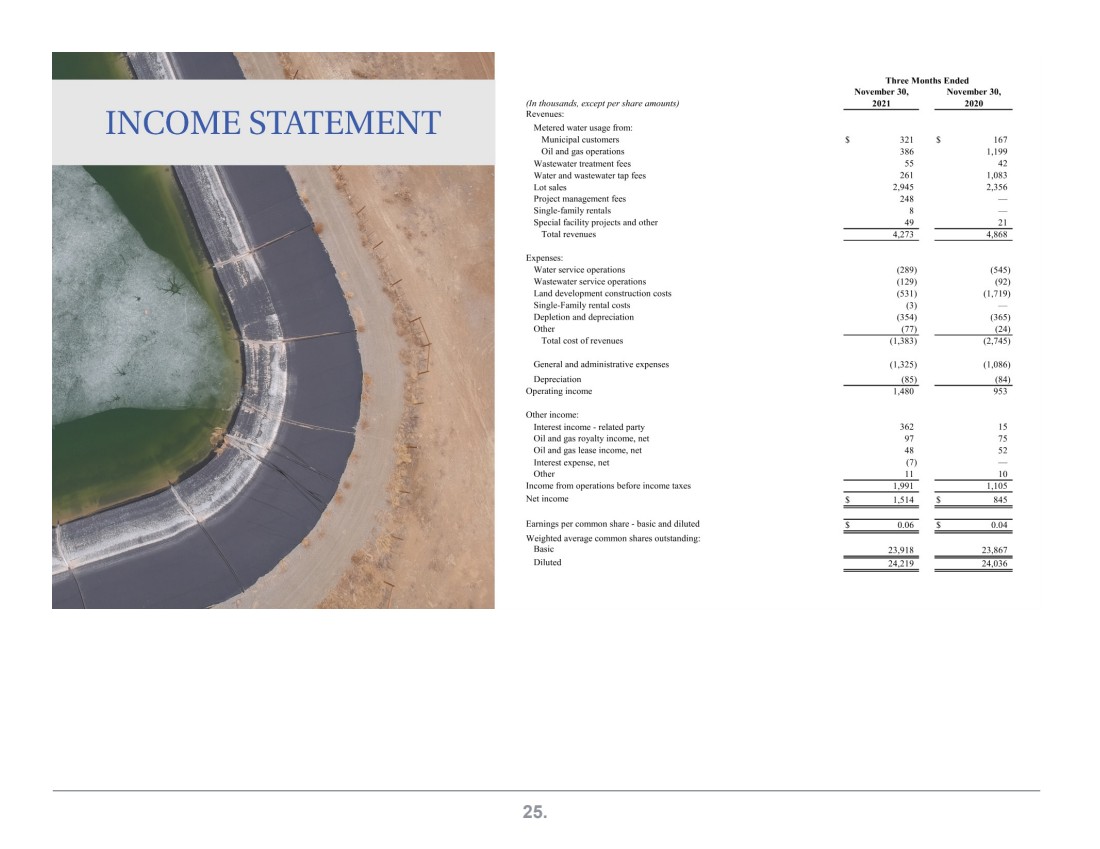
| 25.Three Months Ended November 30, November 30, (In thousand,;, except per share amounts) 2021 2020 INCOME STATEMENT Revenues: Metered water usage from: Municipal customers $ 321 $ 167 Oil and gas operations 386 1,199 \Vastcwater treatment fees 55 42 Water and wastewater tap fees 261 1,083 Lot sales 2,945 2,356 Project management fees 248 Single-family rentals 8 Special facility projects and other 49 21 Total revenues 4,273 4,868 Expenses: \Yater service operations (289) (545) Wastewater service operations (129) (92) Land development construction costs (531) (1,719) Single-Family rental costs (3) Depletion and depreciation (354) (365) Other (77) (24) Total cost of revenues (1,383) (2,745) General and administrative expenses (1,325) (1,086) Depreciation (85) (84) Operating income 1,480 953 Other income: Interest income -related party 362 15 Oil and gas royalty income, net 97 75 Oil and gas lease income, net 48 52 Interest expense, net (7) Other II 10 Income from operations before income taxes 1,991 1,105 Net income $ 1,514 $ 845 Earnings per common share -basic and diluted $ 0.06 $ 0.04 Weighted average common shares outstanding: Basic 23,918 23,867 Diluted 24,219 24,036 |
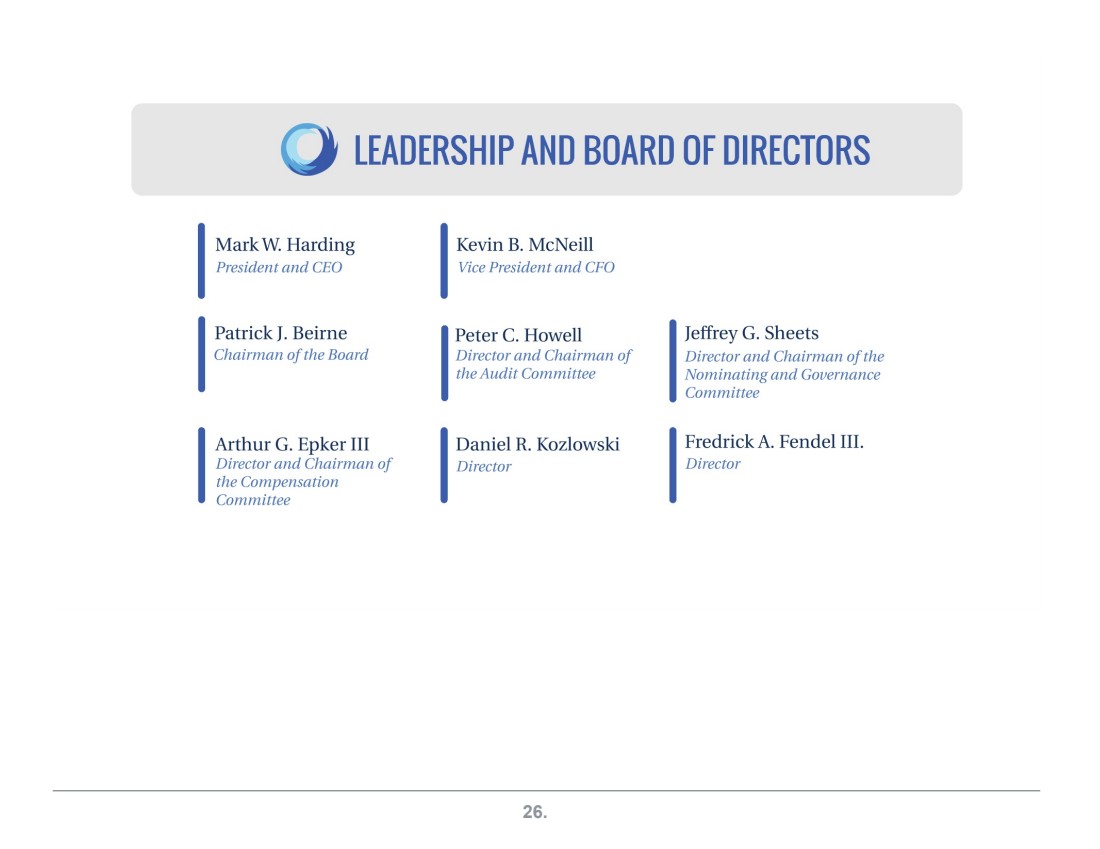
| 26.LEADERSHIP AND BOARD OF DIRECTORS I Mark W Harding President and CEO I Patrick J. Beirne Chairman of the Board I Arthur G. Epker III Director and Chairman of the Compensation Committee I Kevin B. McNeill Vice President and CFO I Peter C. Howell Director and Chairman of the Audit Committee I Daniel R. Kozlowski Director I Jeffrey G. Sheets Director and Chairman of the Nominating and Governance Committee I Fredrick A. Fendel III. Director |
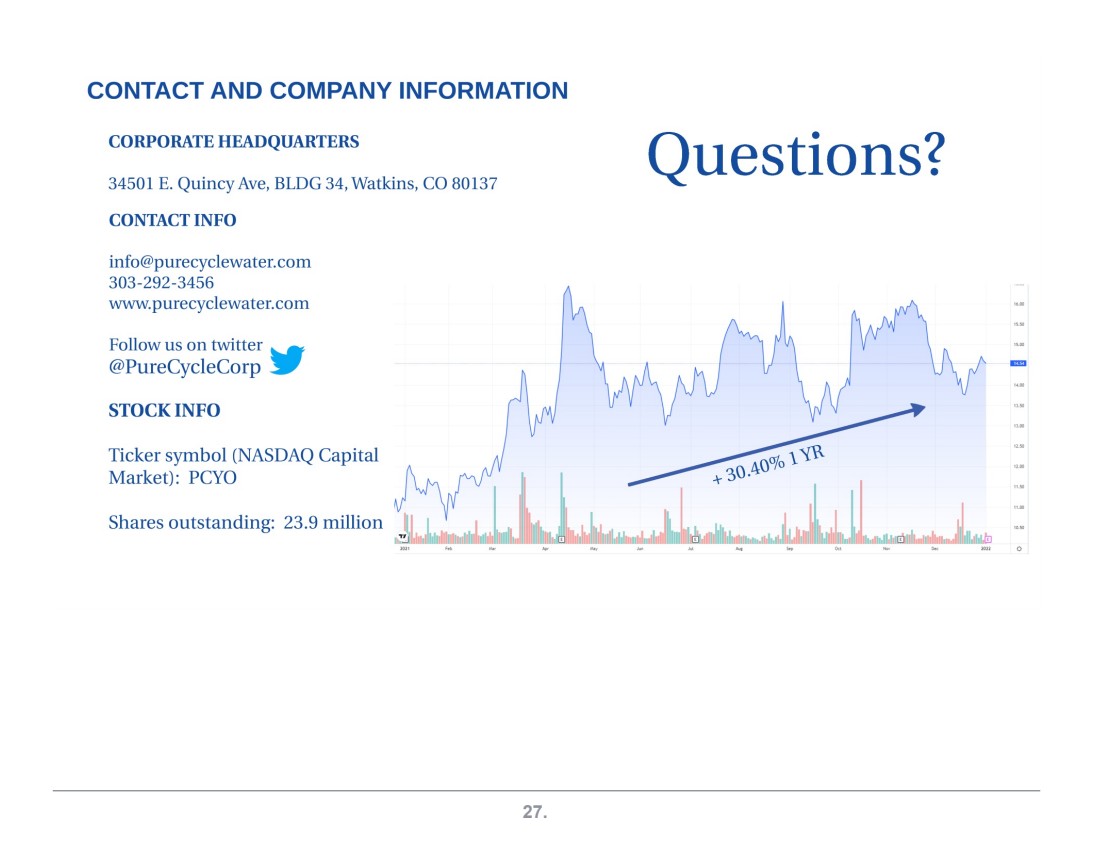
| 27.CONTACT AND COMPANY INFORMATION CORPORATE HEADQUARTERS 34501 E. Quincy Ave, BLDG 34, Watkins, CO 80137 CONTACT INFO info@purecyclewater.com 303-292-3456 www.purecyclewater.com Follow us on twitter ~ @PureCycleCorp STOCK INFO Ticker symbol (NASDAQ Capital Market): PCYO Shares outstanding: 23.9 million CD Questions? 111m CD ~ "" 0 |
| 28.COMPANY OVERVIEW PURE CYCLE CORPORATION Earnings presentation for the three months ended November 30, 2021 FINANCIAL RESULTS |
