| EARNINGS PRESENTATION FOR THE THREE AND SIX MONTHS ENDED FEBRUARY 28, 2023 - .? ,. · n, ~•wr11::1• - -- ... "I,. lit"' • 7 ------ --- · ➔ ---~ __: .,,,...__ ~ -· - - _, "--.---r: -.. ~ - • • - OS ' 'l ' ~ .. •• ~ -r '' ~ : ' ,,,~-!!tlr:: - ~ ~. ~~~r~~if:--,- " r-. I -r~, • -· - - ..... - ~ ---- -. . "l!!!~u 1 • t .!Z.,.:: : : t rl • ~ :-.. -- ~- •I :• ----~ -=·~~ii ~ -· ---== --.cc:;;===:::-:-- ---- -=- ~ - n ~ .. -- _ r I I ,., ,.. II I·,~· ,s- ~ , ·"-hi , ,.,, ~/! ~··· - -- ~ ·"Fi!" - - - ~, ..... , ,. ~ ~-1; ,,( --- ~ ·_ . ~ Presented by Mark Harding, CEO Kevin McNeil!, CFO Dirk Lashnits, VP Land Development '- ; r9 ~ |
| Safe Harbor Statement Statements that are not historical facts contained or incorporated by reference in this presentation are "forward-looking statements" ("FLS") within the meaning of the Private Securities Litigation Reform Act of 1995, Section 27 A of the Securities Act of 1933 and Section 21 C of the Securities Exchange Act of 1934 as amended. FLS involve risks and uncertainties that could cause actual results to differ from projected results. The words "anticipate," "believe," "estimate," "expect," "plan," "intend" and similar expressions, as they relate to us, are intended to identify FLS. Such statements reflect our current views with respect to future events and are subject to certain risks, uncertainties and assumptions. We are not able to predict all factors that may affect future results. We cannot assure you that any of our expectations will be realized. Our actual results could differ materially from those discussed in or implied by these forward-looking statements. Factors that may cause actual results to differ materially from those contemplated by such FLS include, without limitation: the risk factors discussed in our most recent Annual Report on Form l 0-K; the timing of new home construction and other development in the areas where we may sell our water, which in turn may be impacted by credit availability; population growth; employment rates; general economic conditions; the market price of water; changes in customer consumption patterns; changes in applicable statutory and regulatory requirements; changes in governmental policies and procedures; uncertainties in the estimation of water available under decrees; uncertainties in the estimation of costs of delivery of water and treatment of wastewater; uncertainties in the estimation of the service life of our systems; uncertainties in the estimation of costs of construction projects; uncertainties in the amount and timing of reimbursable public improvement payments: uncertainty in the single family home rental market and our ability to rent homes in a timely manner or at the amount we project; the strength and financial resources of our competitors; our ability to find and retain skilled personnel; climatic and weather conditions, including flood, droughts and freezing conditions; labor relations; availability and cost of labor, material and equipment; delays in anticipated permit and construction dates; environmental risks and regulations; our ability to raise capital; our ability to negotiate contracts with new customers; and uncertainties in water court rulings; and other factors discussed from time to time in our press releases, public statements and documents filed or furnished with the SEC. |
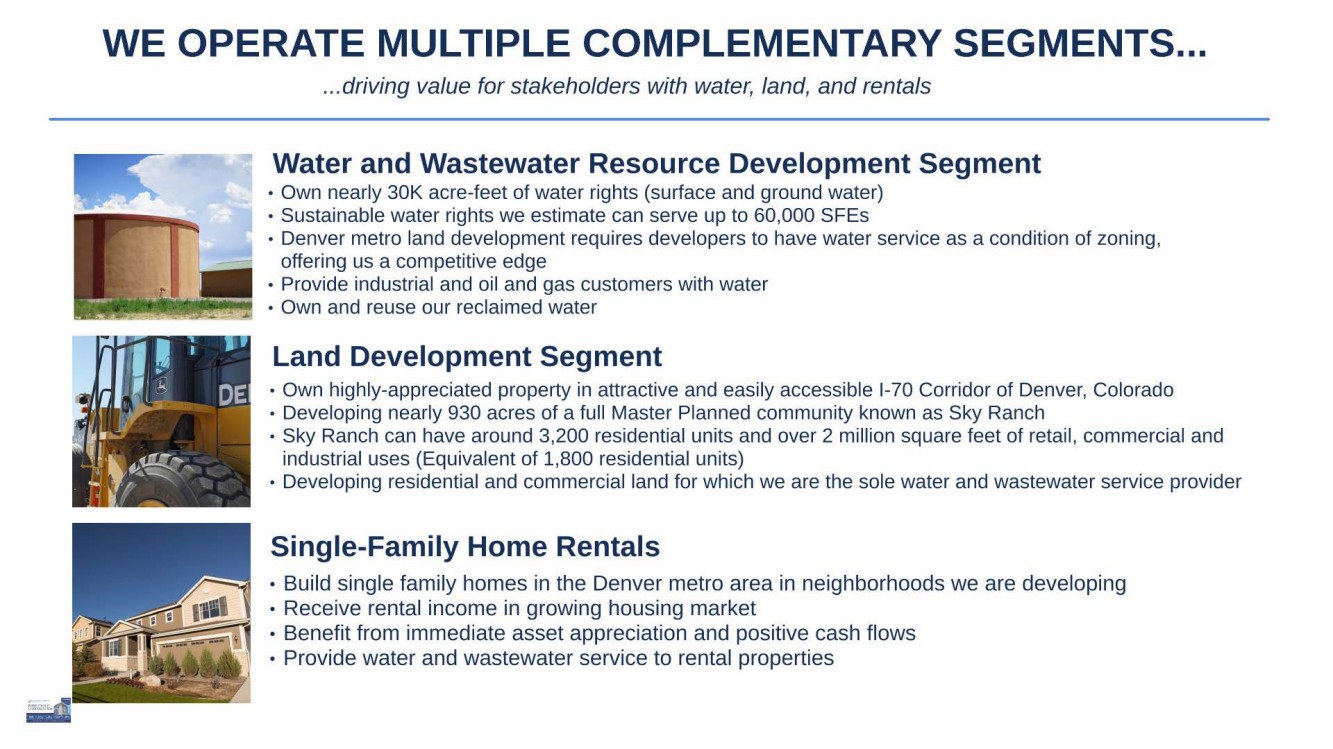
| WE OPERATE MULTIPLE COMPLEMENTARY SEGMENTS ... . . . driving value for stakeholders with water, land, and rentals Water and Wastewater Resource Development Segment • Own nearly 30K acre-feet of water rights (surface and ground water) • Sustainable water rights we estimate can serve up to 60,000 SFEs • Denver metro land development requires developers to have water service as a condition of zoning, offering us a competitive edge • Provide industrial and oil and gas customers with water • Own and reuse our reclaimed water Land Development Segment • Own highly-appreciated property in attractive and easily accessible I-70 Corridor of Denver, Colorado • Developing nearly 930 acres of a full Master Planned community known as Sky Ranch • Sky Ranch can have around 3,200 residential units and over 2 million square feet of retail, commercial and industrial uses (Equivalent of 1,800 residential units) • Developing residential and commercial land for which we are the sole water and wastewater service provider Single-Family Home Rentals • Build single family homes in the Denver metro area in neighborhoods we are developing • Receive rental income in growing housing market • Benefit from immediate asset appreciation and positive cash flows • Provide water and wastewater service to rental properties |
| EARNINGS PRESENTATION FOR THE THREE AND SIX MONTHS ENDED FEBRUARY 28, 2023 - .? ,. · n, ~•wr11::1• - -- ... "I,. lit"' • 7 ------ --- · ➔ ---~ __: .,,,...__ ~ -· - - _, "--.---r: -.. ~ - • • - OS ' 'l ' ~ .. •• ~ -r '' ~ : ' ,,,~-!!tlr:: - ~ ~. ~~~r~~if:--,- " r-. I -r~, • -· - - ..... - ~ ---- -. . "l!!!~u 1 • t .!Z.,.:: : : t rl • ~ :-.. -- ~- •I :• ----~ -=·~~ii ~ -· ---== --.cc:;;===:::-:-- ---- -=- ~ - n ~ .. -- _ r I I ,., ,.. II I·,~· ,s- ~ , ·"-hi , ,.,, ~/! ~··· - -- ~ ·"Fi!" - - - ~, ..... , ,. ~ ~-1; ,,( --- ~ ·_ . ~ Presented by Mark Harding, CEO Kevin McNeil!, CFO Dirk Lashnits, VP Land Development '- ; r9 ~ |

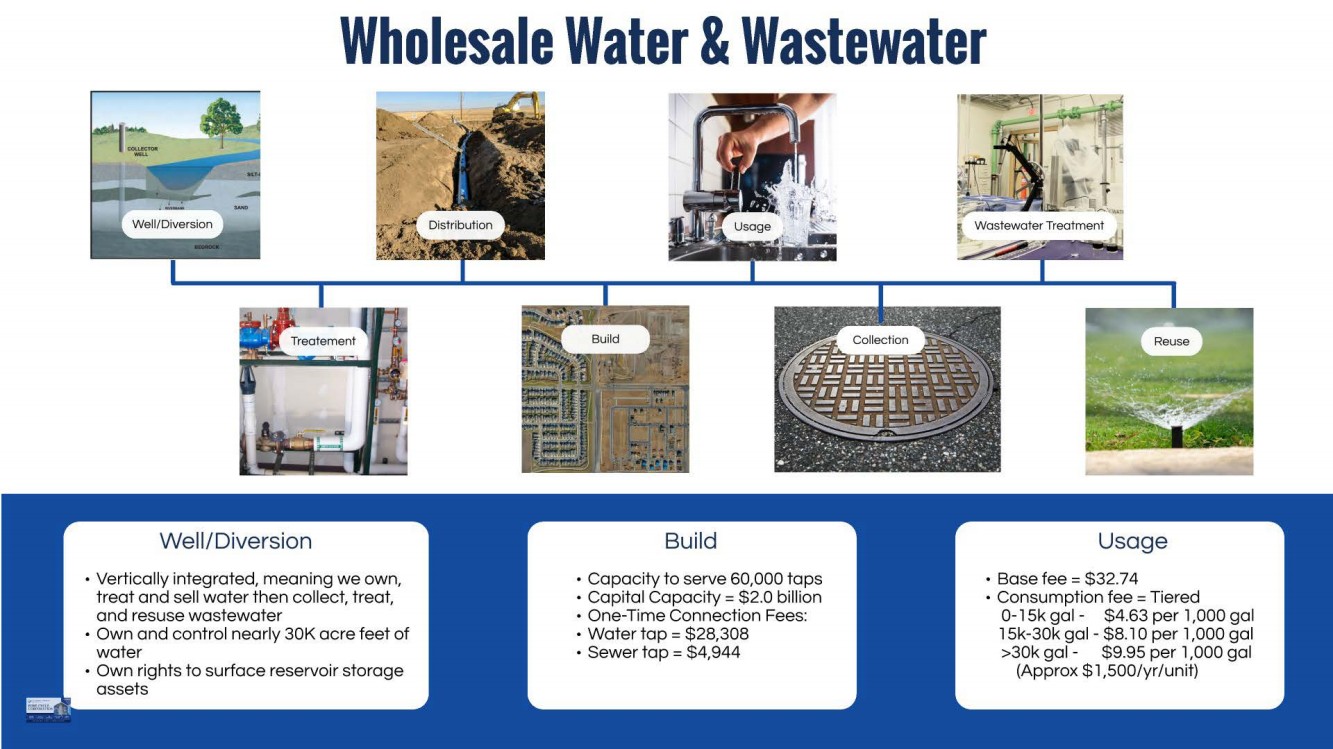
| Wholesale Water & Wastewater Well/Diversion • Vertically integrated, meaning we own, treat and sell water then collect, treat, and resuse wastewater • Own and control nearly 30K acre feet of water • Own rights to surface reservoir storage assets Build • Capacity to serve 60,000 taps • Capital Capacity = $2.0 billion • One-Time Connection Fees: • Water tap = $28,308 • Sewer tap= $4,944 Usage • Base fee= $32.74 • Consumption fee = Tiered 0-1 Sk gal - $4.63 per 1,000 gal l 5k-30k gal - $8. l O per 1,000 gal >30k gal - $9.95 per 1,000 gal (Approx $7,500/yr/unit) |
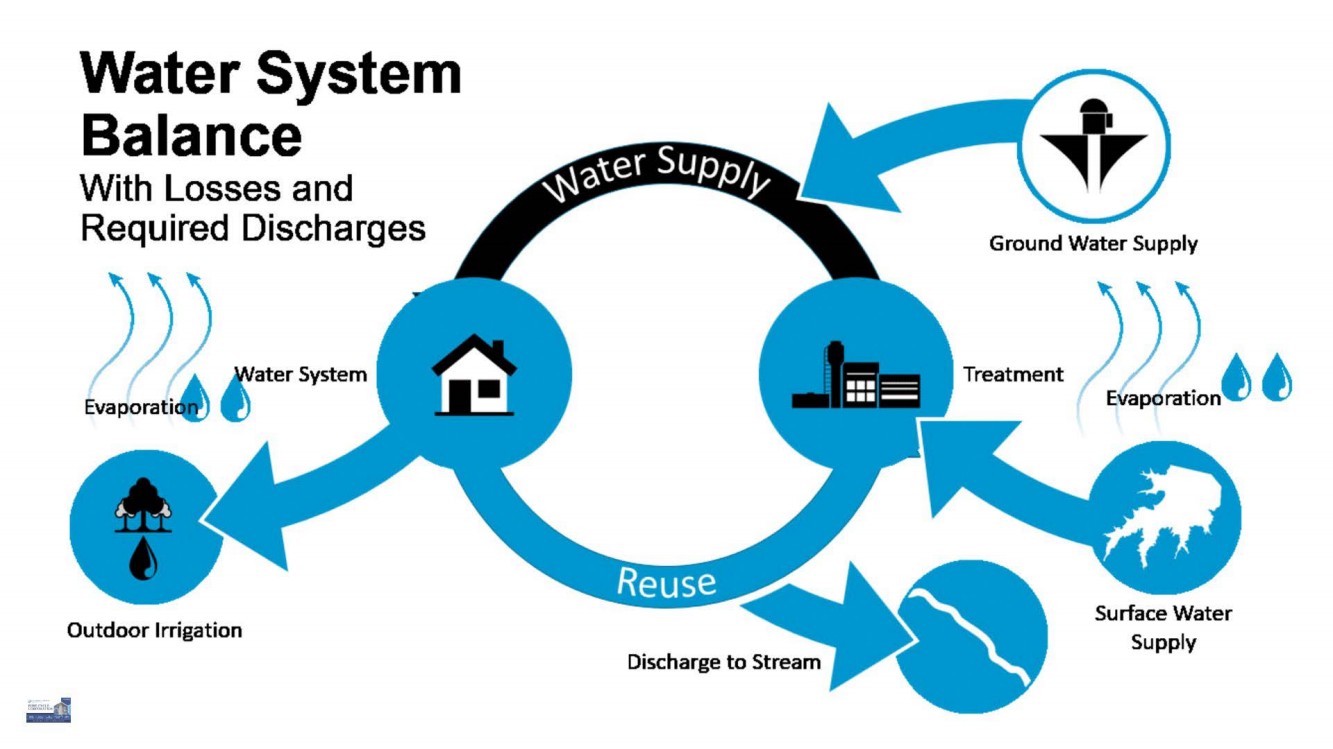
| Water System Balance With Losses and Required Discharges Outdoor Irrigation Discharge to Stream Ground Water Supply Treatment £. £. Evaporation~ ~ Surface Water Supply |
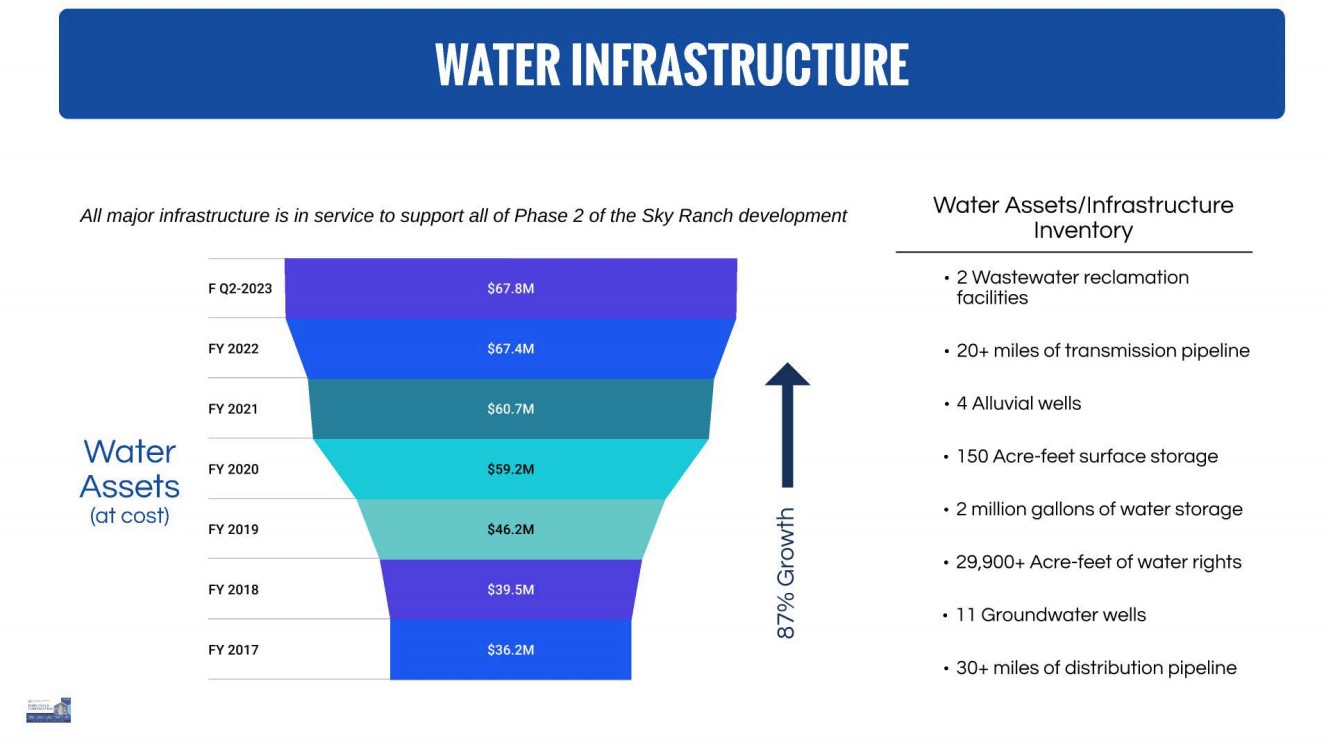
| All major infrastructure is in service to support all of Phase 2 of the Sky Ranch development F Q2-2023 FY 2022 FY 2021 Water Assets FY 2020 (at cost) FY 2019 FY 2018 FY 2017 $59.2M $46.2M ....c +- s 0 lo... CD ~ r--. CX) Water Assets/Infrastructure Inventory • 2 Wastewater reclamation facilities • 20+ miles of transmission pipeline • 4 Alluvial wells • 150 Acre-feet surface storage • 2 million gallons of water storage • 29,900+ Acre-feet of water rights • 11 Groundwater wells • 30+ miles of distribution pipeline |
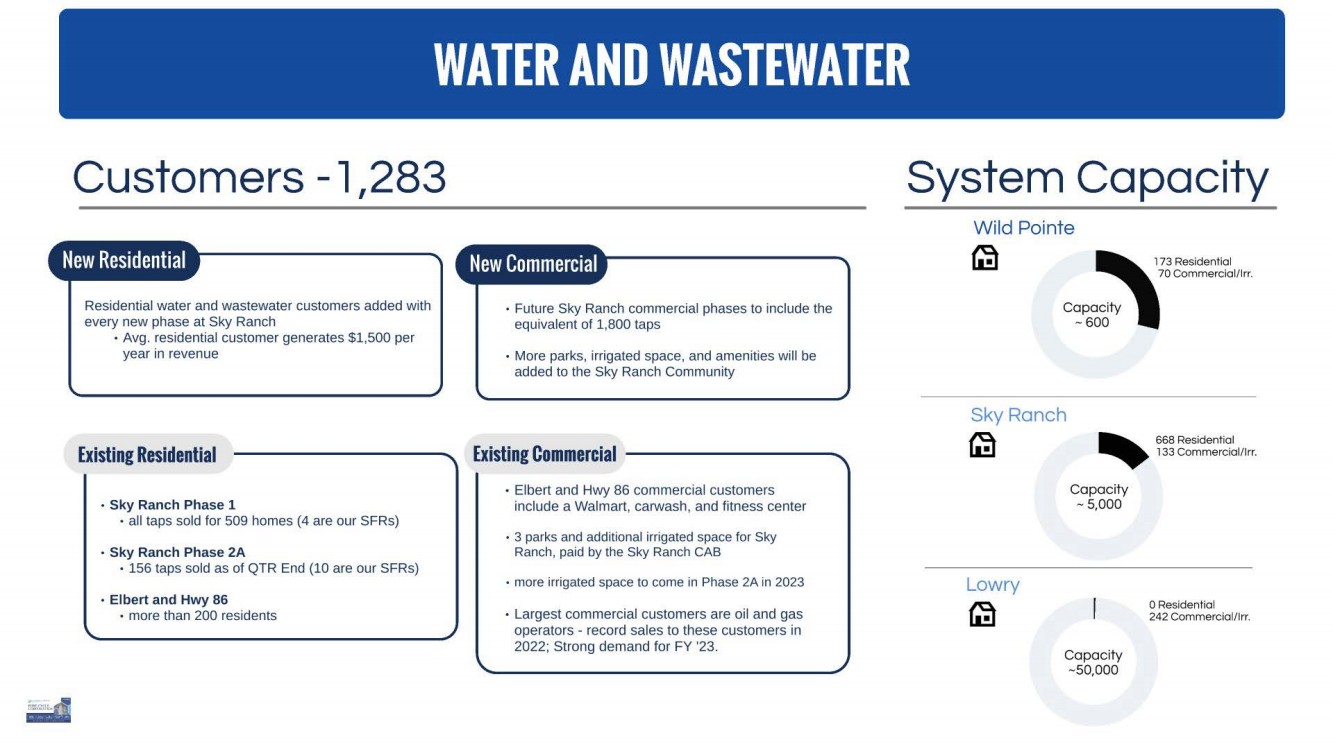
| Customers - 1,283 New Residential Residential water and wastewater customers added with every new phase at Sky Ranch • Avg. residential customer generates $1,500 per year in revenue Existing Residential • Sky Ranch Phase 1 • all taps sold for 509 homes (4 are our SFRs) • Sky Ranch Phase 2A • 156 taps sold as of QTR End (10 are our SFRs) • Elbert and Hwy 86 • more than 200 residents New Commercial • Future Sky Ranch commercial phases to include the equivalent of 1,800 taps • More parks, irrigated space, and amenities will be added to the Sky Ranch Community Existing Commercial • Elbert and Hwy 86 commercial customers include a Walmart, carwash, and fitness center • 3 parks and additional irrigated space for Sky Ranch, paid by the Sky Ranch CAB • more irrigated space to come in Phase 2A in 2023 • Largest commercial customers are oil and gas operators - record sales to these customers in 2022; Strong demand for FY '23. System Capacity Wild Pointe Copa ~ 60 Sky Ranch 73 Residential 70 Commercial/Irr. ~ ...... ~ 668 Residential 133 Commercial/Irr. Lowry ~ Capacity ~ 5,000 Capacity ~50,000 0 Residential 242 Commercial/Irr. |
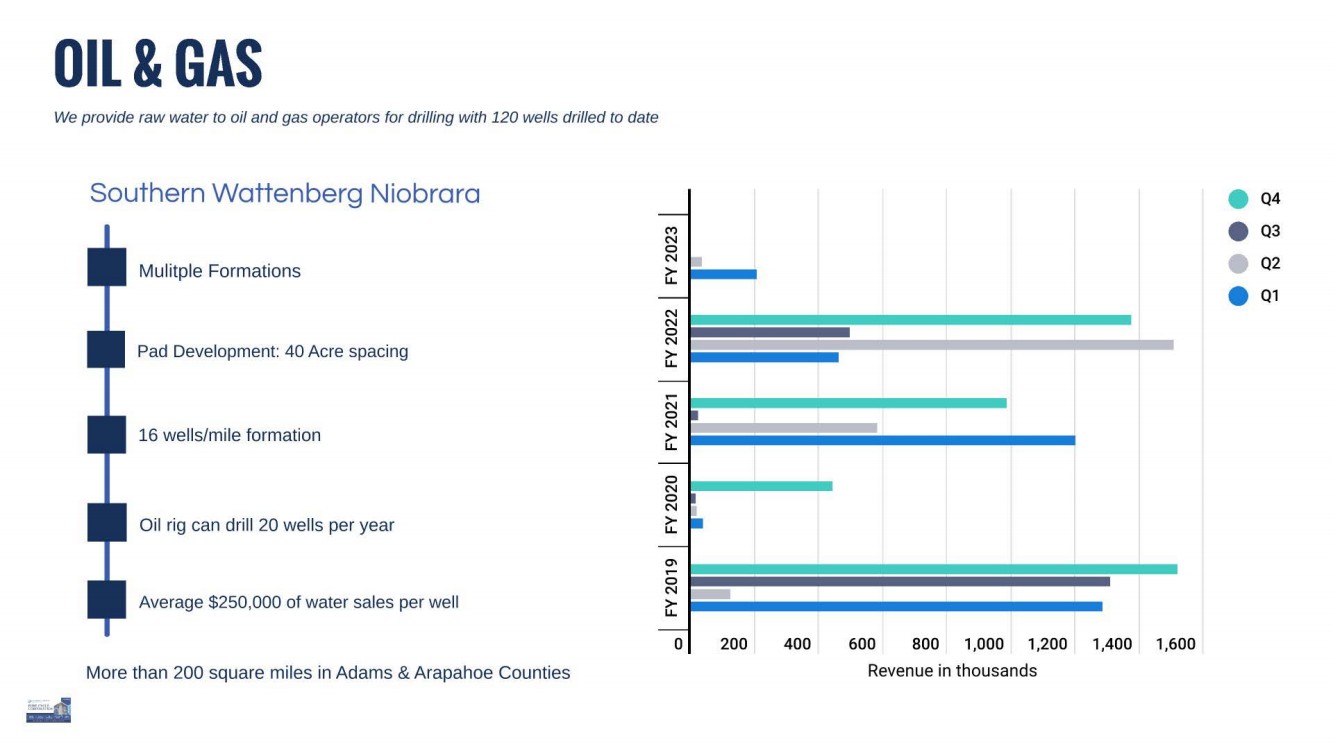
| OIL& GAS We provide raw water to oil and gas operators for drilling with 120 wells drilled to date Southern Wattenberg Niobrara • Q4 - ('I) N • Q3 0 Mulitple Formations N 1 > LL • Q2 - • Q1 N N I 0 Pad Development: 40 Acre spacing N > LL - ..... 16 wells/mile formation N I 0 I N > LL - 0 N Oil rig can drill 20 wells per year 0 I N > LL ~ - "' .... 0 Average $250,000 of water sales per well N ---, > LL - 0 200 400 600 800 1,000 1,200 1,400 1,6 00 More than 200 square miles in Adams & Arapahoe Counties Revenue in thousands |
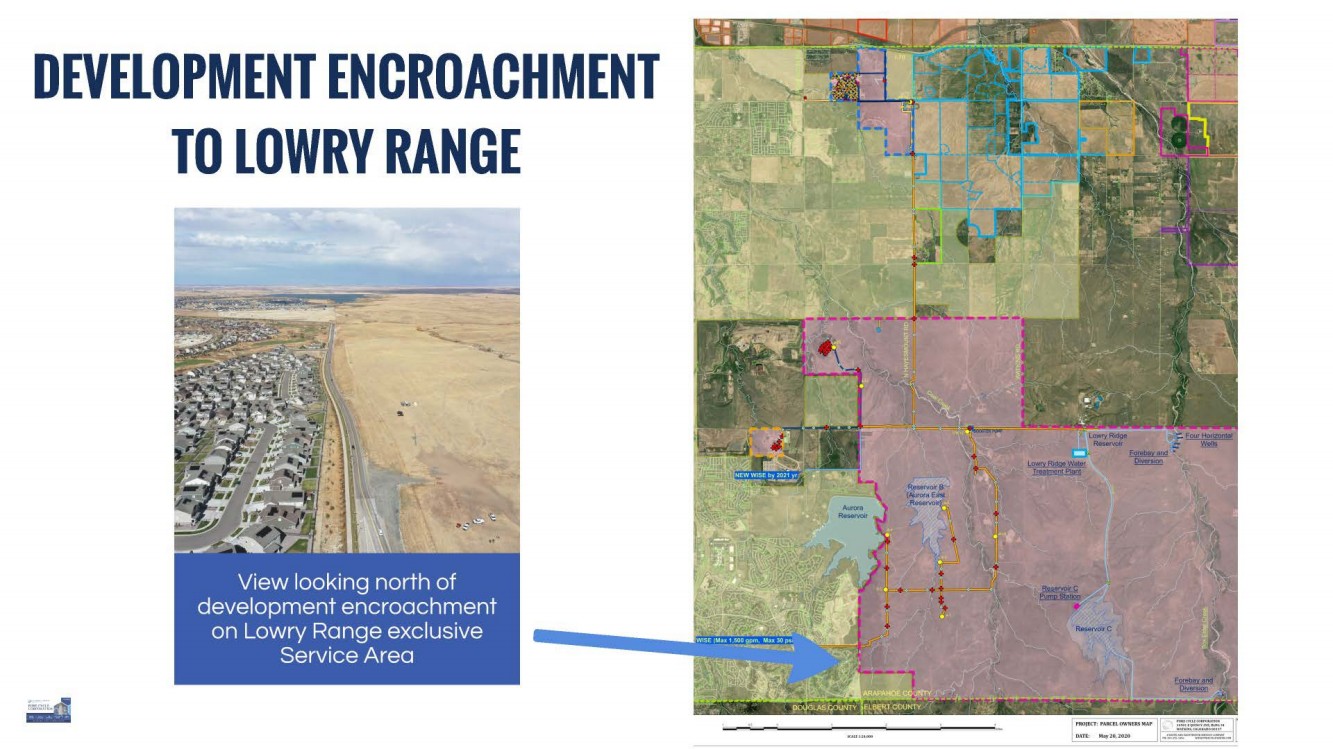
| DEVELOPMENT ENCROACHMENT TO LOWRY RANGE |
| EARNINGS PRESENTATION FOR THE THREE AND SIX MONTHS ENDED FEBRUARY 28, 2023 - .? ,. · n, ~•wr11::1• - -- ... "I,. lit"' • 7 ------ --- · ➔ ---~ __: .,,,...__ ~ -· - - _, "--.---r: -.. ~ - • • - OS ' 'l ' ~ .. •• ~ -r '' ~ : ' ,,,~-!!tlr:: - ~ ~. ~~~r~~if:--,- " r-. I -r~, • -· - - ..... - ~ ---- -. . "l!!!~u 1 • t .!Z.,.:: : : t rl • ~ :-.. -- ~- •I :• ----~ -=·~~ii ~ -· ---== --.cc:;;===:::-:-- ---- -=- ~ - n ~ .. -- _ r I I ,., ,.. II I·,~· ,s- ~ , ·"-hi , ,.,, ~/! ~··· - -- ~ ·"Fi!" - - - ~, ..... , ,. ~ ~-1; ,,( --- ~ ·_ . ~ Presented by Mark Harding, CEO Kevin McNeil!, CFO Dirk Lashnits, VP Land Development '- ; r9 ~ |

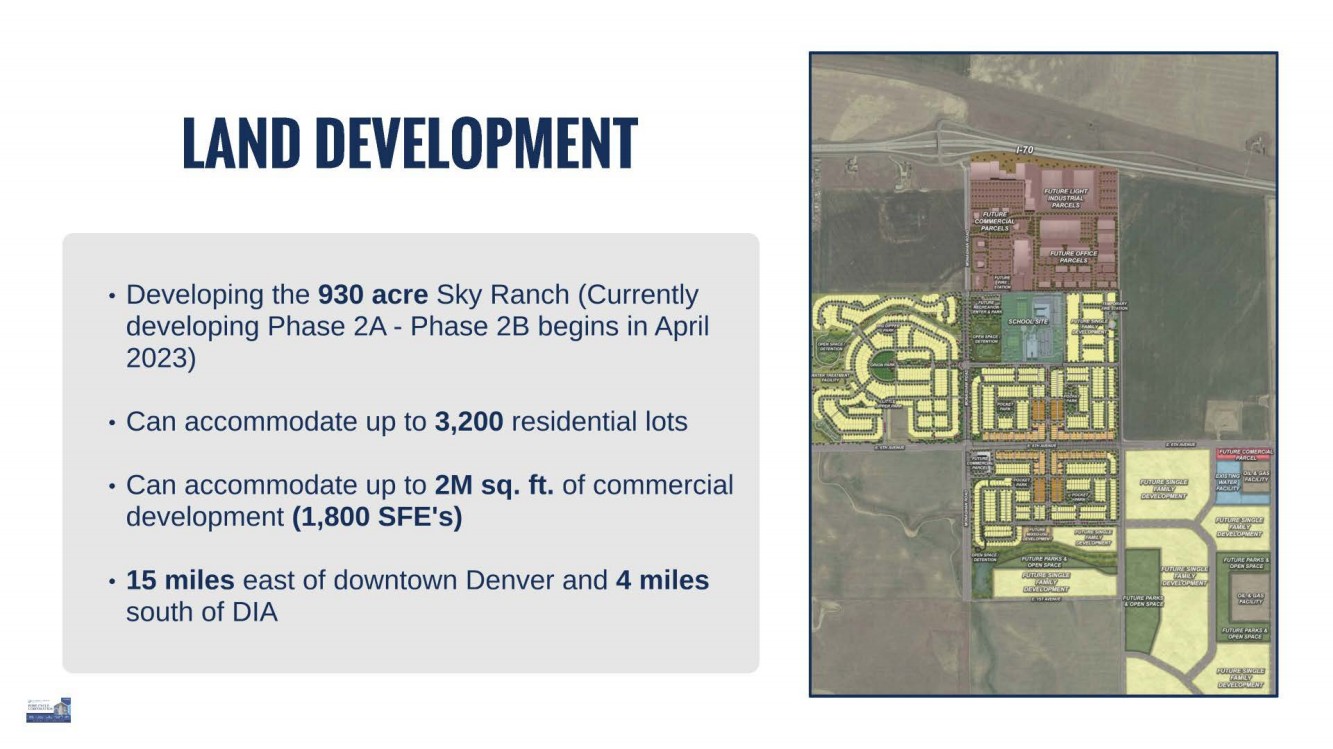
| LAND DEVELOPMENT • Developing the 930 acre Sky Ranch (Currently developing Phase 2A - Phase 28 begins in April 2023) • Can accommodate up to 3,200 residential lots • Can accommodate up to 2M sq. ft. of commercial development (1,800 SFE's) • 15 miles east of downtown Denver and 4 miles south of DIA |
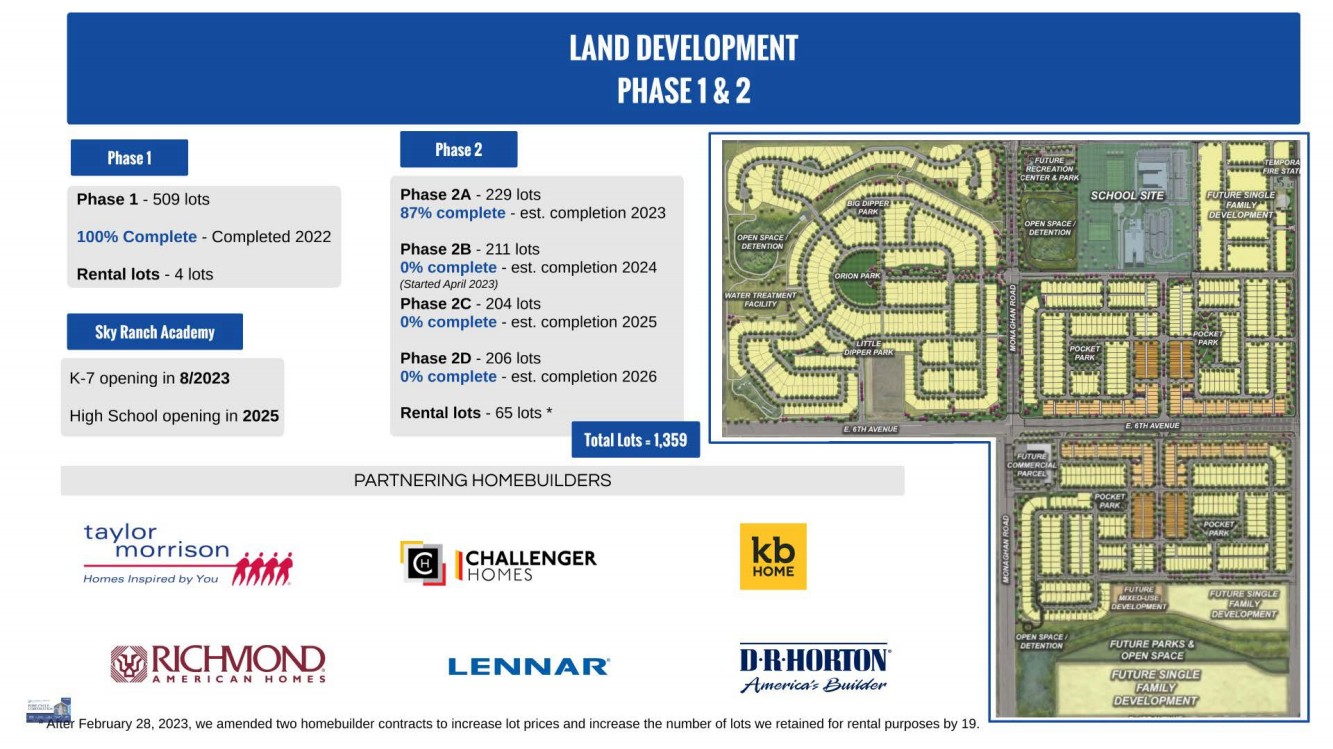
| Phase 1 Phase 1 - 509 lots 100% Complete - Completed 2022 Rental lots - 4 lots Sky Ranch Academy K-7 opening in 8/2023 High School opening in 2025 taylor . morrison •..• Homes Inspired by You ~ ~~ RICI-MON) ~AMERICAN HOME ; Phase 2 Phase 2A - 229 lots 87% complete - est. completion 2023 Phase 2B - 211 lots 0% complete - est. completion 2024 (Started April 2023) Phase 2C - 204 lots 0% complete - est. completion 2025 Phase 2D - 206 lots 0% complete - est. completion 2026 Rental lots - 65 lots * Total Lots = 1,359 PARTNERING HOMEBUILDERS I CHALLENGER HO MES LENNAR" kb HOME D·R·HORTIJN. A #fe,f'fca-'$ ~ it:fm~, February 28, 2023, we amended two homebuilder contracts to increase lot prices and increase the number of lots we retained for rental purposes by 19. l.!;;;;:;!!!!!!!!!!!::===========~===!.J |
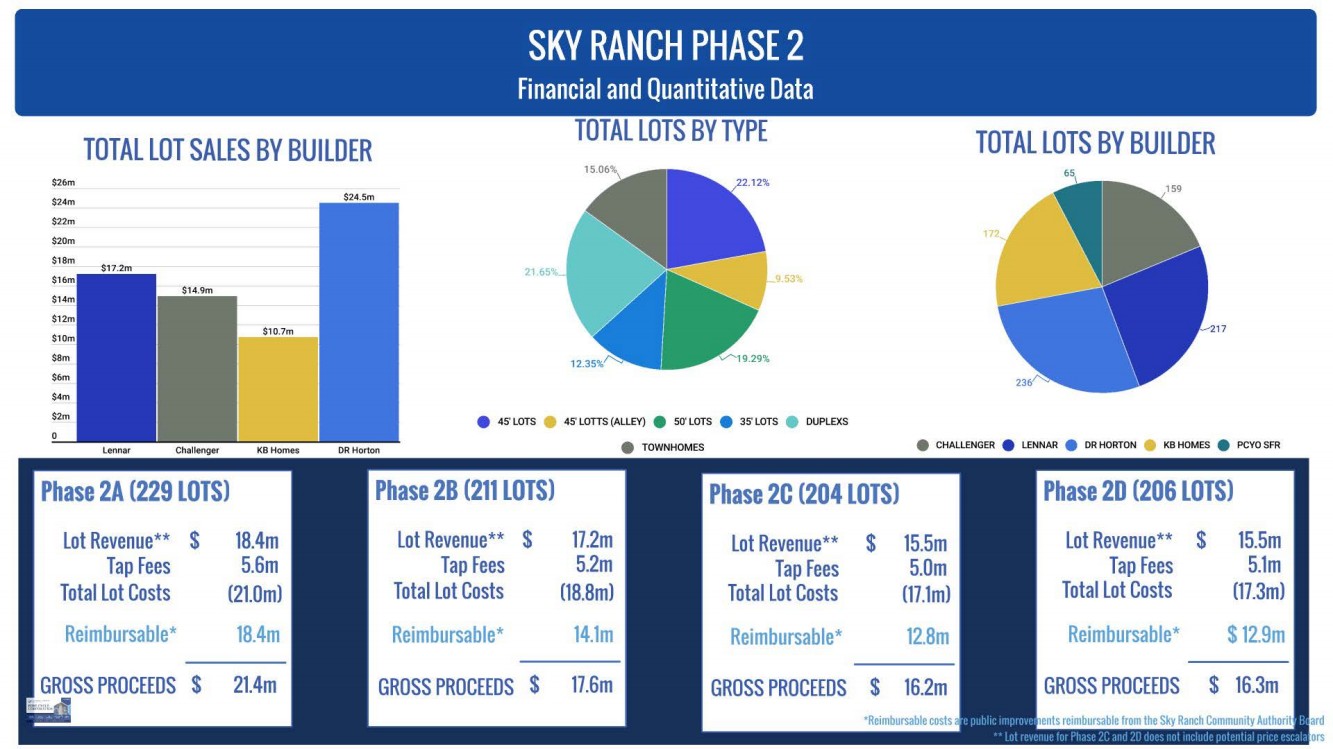
| TOTAL LOT SALES BY BUILDER$26m $24m $22m $20m $18m $17.2m $ 10.7m Phase 2A (229 LOTS) Lot Revenue** $ 18.4m Tap Fees 5.6m Total Lot Costs (21.Om) Reimbursable* 18.4m $ 21.4m $24.Sm SKY RANCH PHASE 2 Financial and Quantitative Data TOTAL LOTS BY TYPE TOTAL LOTS BY BUILDER • 45' LOTS • 45' LOTTS (ALLEY) • 50' LOTS • 35' LOTS • DUPLEXS • CHALLENGER • LENNAR • DR HORTON • KB HOMES • PCYO SFR Phase 28 (211 LOTS) Phase 2C (204 LOTS) Phase 20 (206 LOTS) Lot Revenue** $ 17.2m Lot Revenue** $ 15.5m Lot Revenue** $ 15.5m Tap Fees 5.2m Tap Fees 5.Om Tap Fees 5.lm Total Lot Costs (18.8m) Total Lot Costs (17.lm) Total Lot Costs (17.3m) Reimbursable* 14.lm Reimbursable* 12.8m Reimbursable* GROSS PROCEEDS $ 17.6m GROSS PROCEEDS $ 16.2m GROSS PROCEEDS $ 16.3m *Reimbursable costs a ors |
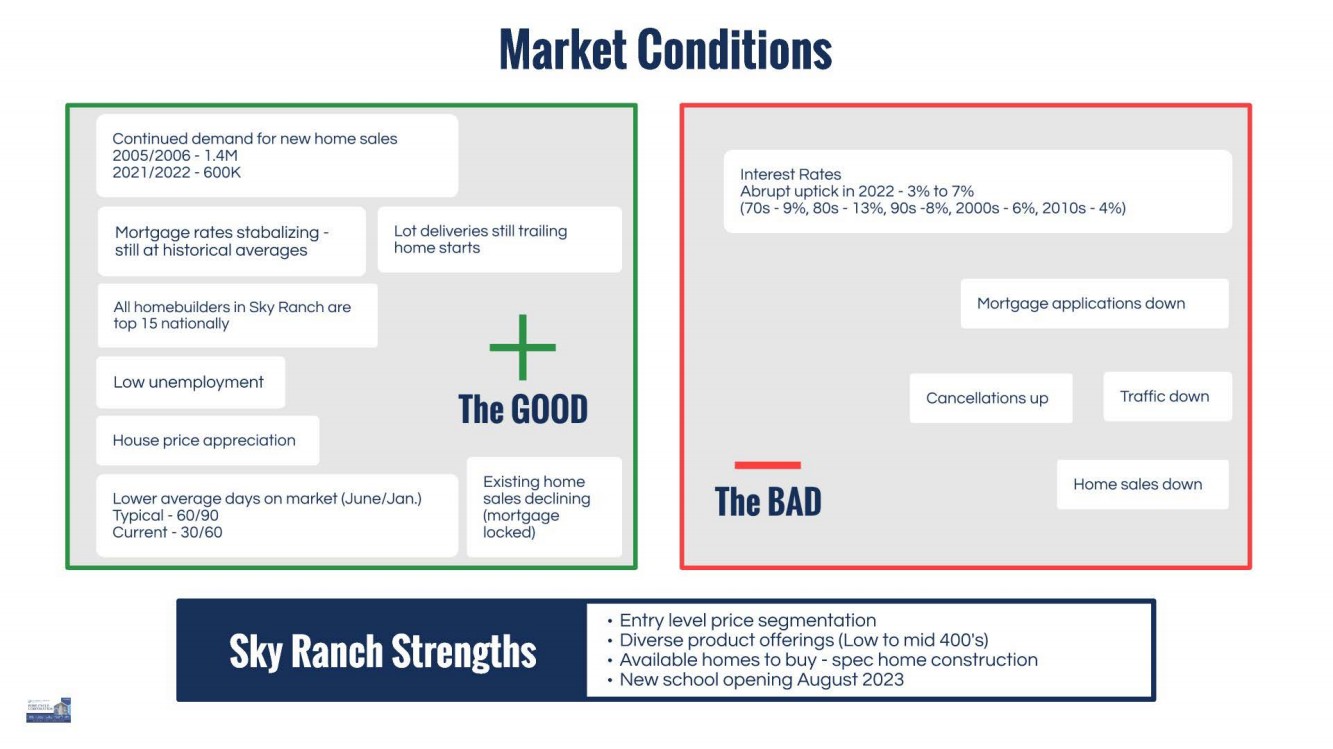
| Market Conditions Continued demand for new home sales 2005/2006 - 1 .4M 2021 /2022 - 600K Mortgage rates stabalizing - still at historical averages Lot deliveries stil l trailing home starts All homebuilders in Sky Ranch are top 15 nationally Low unemployment House price appreciation Lower average days on market (June/Jan.) Typical - 60/90 Current - 30/60 + The GOOD Existing home sales declining (mortgage locked) Interest Rates Abrupt uptick in 2022 - 3% to 7% (70s - 9%, 80s - 13%, 90s -8%, 2000s - 6%, 201 Os - 4%) Mortgage applications down Cancellations up Traffic down The BAD Home sales down • Entry level price segmentation • Diverse product offerings (Low to mid 400's) • Available homes to buy - spec home construction • New school opening August 2023 |
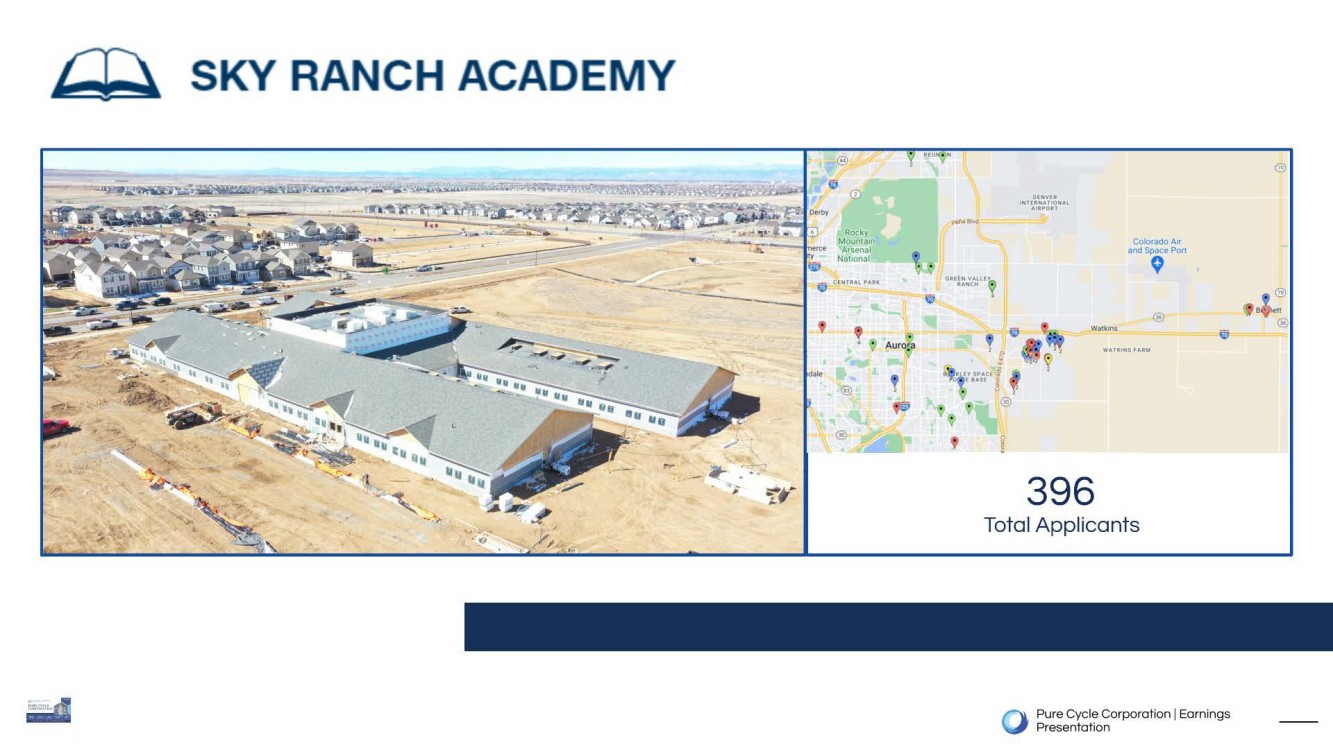
| SKY RANCH ACADEMY GRf.::NYtJlt~ • DCNVU INrUINATIONAL AUIPORl Watkins 396 Colorado Air and Space Port ' Total Applicants 0 Pure Cycle Corporation I Earnings Presentation ® @ a en @ |
| EARNINGS PRESENTATION FOR THE THREE AND SIX MONTHS ENDED FEBRUARY 28, 2023 - .? ,. · n, ~•wr11::1• - -- ... "I,. lit"' • 7 ------ --- · ➔ ---~ __: .,,,...__ ~ -· - - _, "--.---r: -.. ~ - • • - OS ' 'l ' ~ .. •• ~ -r '' ~ : ' ,,,~-!!tlr:: - ~ ~. ~~~r~~if:--,- " r-. I -r~, • -· - - ..... - ~ ---- -. . "l!!!~u 1 • t .!Z.,.:: : : t rl • ~ :-.. -- ~- •I :• ----~ -=·~~ii ~ -· ---== --.cc:;;===:::-:-- ---- -=- ~ - n ~ .. -- _ r I I ,., ,.. II I·,~· ,s- ~ , ·"-hi , ,.,, ~/! ~··· - -- ~ ·"Fi!" - - - ~, ..... , ,. ~ ~-1; ,,( --- ~ ·_ . ~ Presented by Mark Harding, CEO Kevin McNeil!, CFO Dirk Lashnits, VP Land Development '- ; r9 ~ |

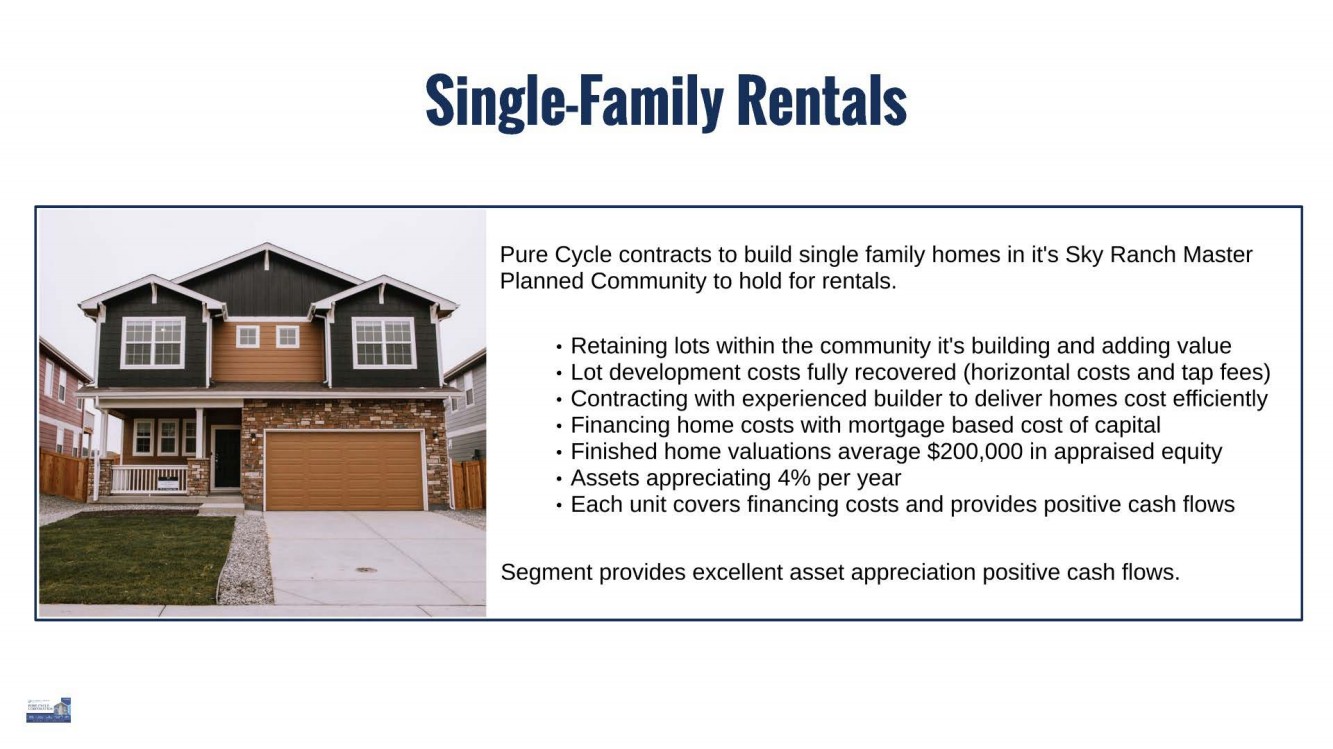
| Single-Family Rentals Pure Cycle contracts to build single family homes in it's Sky Ranch Master Planned Community to hold for rentals. • Retaining lots within the community it's building and adding value • Lot development costs fully recovered (horizontal costs and tap fees) • Contracting with experienced builder to deliver homes cost efficiently • Financing home costs with mortgage based cost of capital • Finished home valuations average $200,000 in appraised equity • Assets appreciating 4% per year • Each unit covers financing costs and provides positive cash flows Segment provides excellent asset appreciation positive cash flows. |
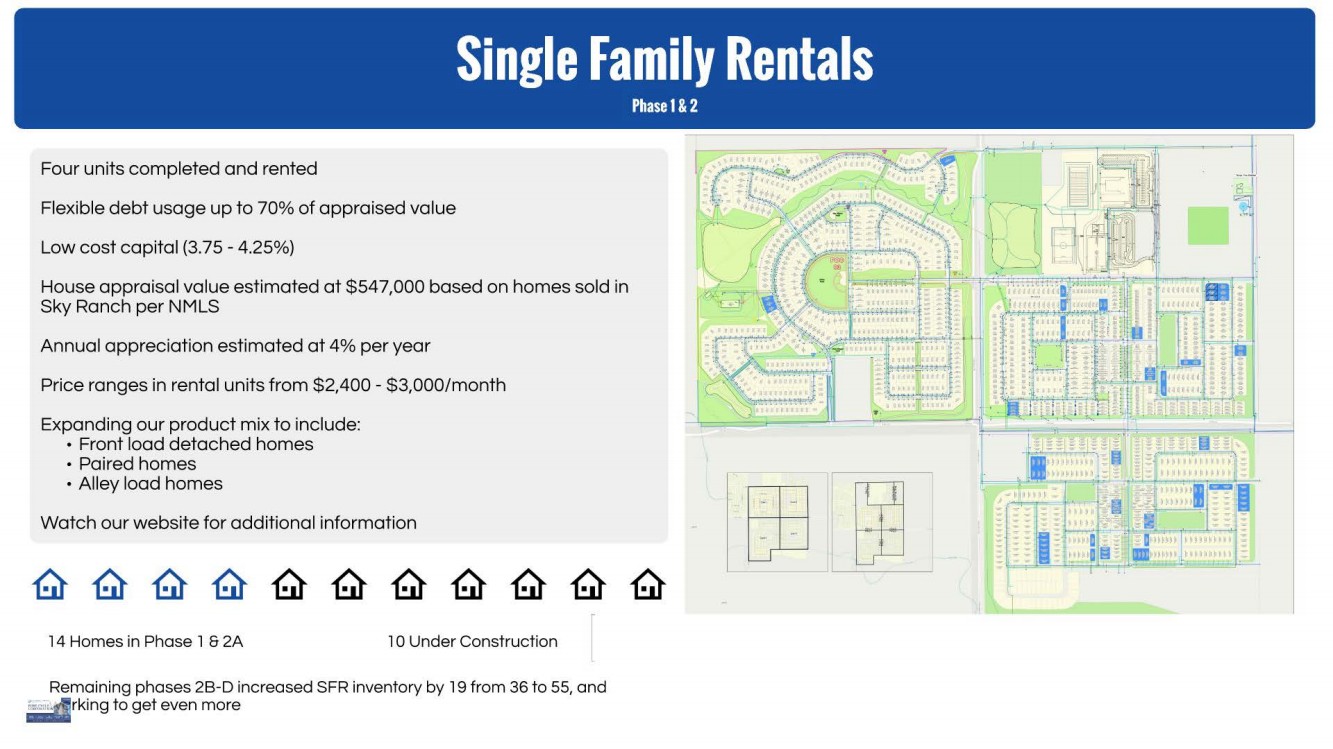
| Four units completed and rented Flexible debt usage up to 70% of appraised value Low cost capital (3.75 - 4.25%) House appraisal value estimated at $547,000 based on homes sold in Sky Ranch per NMLS Annual appreciation estimated at 4% per year Price ranges in rental units from $2,400 - $3,000/month Expanding our product mix to include: • Front load detached homes • Paired homes • Alley load homes Watch our website for additional information ~~~~ ~~~~~~~ 14 Homes in Phase 1 & 2A 1 O Under Construction [ Remaining phases 28-D increased SFR inventory by 19 from 36 to 55, and itiu,:ii":,.d rking to get even more - ~ • ~9 II Ii II . ,\ .- l ~ • r I { ' .-:,: . ,·· -~ " --- '".;r"'. ..... ,-;::,-t~ f J •.• ~ - · _ .. , ··.: • fl • • IJ •• ·...... -;~ .. : . ·.:. . - ... " .., ... ... .. . |
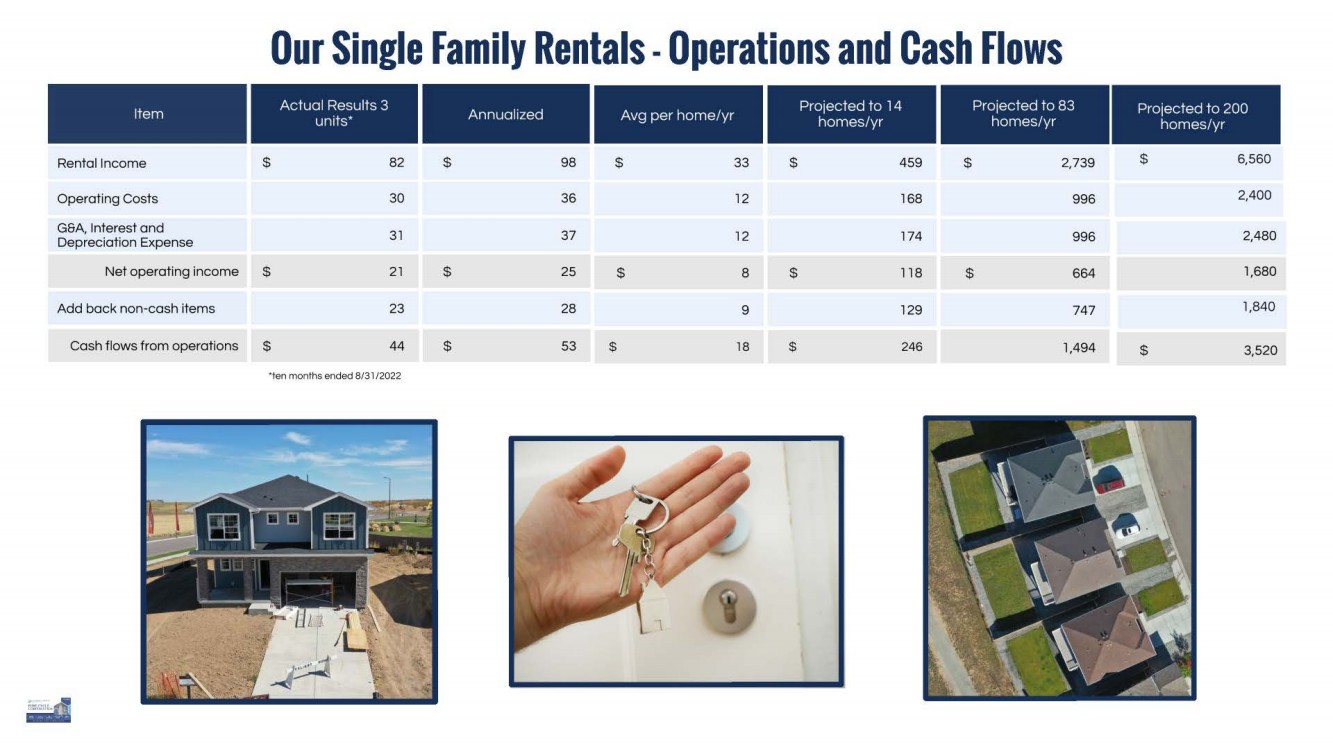
| Item Rental Income Operating Costs G&A, Interest and Depreciation Expense Net operating income Add back non-cash items Cash flows from operations Our Single Family Rentals -Operations and Cash Flows $ $ $ Actual Results 3 units* 82 30 37 27 23 44 •ten months ended 8/3 l /2022 Annualized $ $ $ Avg per home/yr 98 $ 33 36 72 37 72 25 $ 8 28 9 53 $ 18 $ $ $ Projected to 14 homes/yr 459 768 174 778 129 246 $ Projected to 83 homes/yr 2,739 996 996 $ 664 747 7,494 Projected to 200 homes/yr $ 6,560 2,400 2,480 7,680 7,840 $ 3,520 |
| EARNINGS PRESENTATION FOR THE THREE AND SIX MONTHS ENDED FEBRUARY 28, 2023 - .? ,. · n, ~•wr11::1• - -- ... "I,. lit"' • 7 ------ --- · ➔ ---~ __: .,,,...__ ~ -· - - _, "--.---r: -.. ~ - • • - OS ' 'l ' ~ .. •• ~ -r '' ~ : ' ,,,~-!!tlr:: - ~ ~. ~~~r~~if:--,- " r-. I -r~, • -· - - ..... - ~ ---- -. . "l!!!~u 1 • t .!Z.,.:: : : t rl • ~ :-.. -- ~- •I :• ----~ -=·~~ii ~ -· ---== --.cc:;;===:::-:-- ---- -=- ~ - n ~ .. -- _ r I I ,., ,.. II I·,~· ,s- ~ , ·"-hi , ,.,, ~/! ~··· - -- ~ ·"Fi!" - - - ~, ..... , ,. ~ ~-1; ,,( --- ~ ·_ . ~ Presented by Mark Harding, CEO Kevin McNeil!, CFO Dirk Lashnits, VP Land Development '- ; r9 ~ |

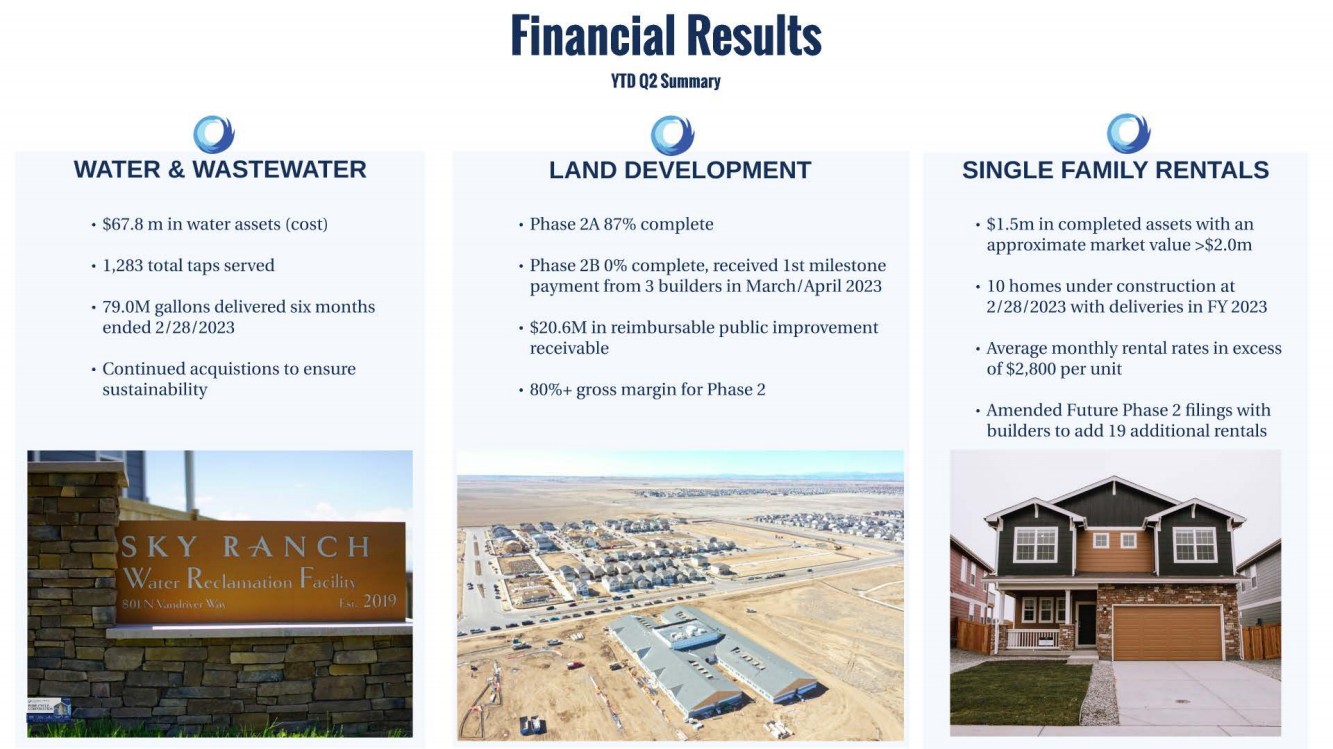
| WATER & WASTEWATER • $67.8 min water assets (cost) • 1,283 total taps served • 79.0M gallons delivered six months ended 2/28/2023 • Continued acquistions to ensure sustainability Financial Results YTD 02 Summary LAND DEVELOPMENT • Phase 2A 87% complete • Phase 2B 0% complete, received 1st milestone payment from 3 builders in March/ April 2023 • $20.6M in reimbursable public improvement receivable • 80%+ gross margin for Phase 2 -:r.~ . ~ ....... " ~~~ ~~~~~¢!' · - ·--~ ..·· -- -.............. - .... SINGLE FAMILY RENTALS • $1.5m in completed assets with an approximate market value >$2.0m • 10 homes under construction at 2/28/2023 with deliveries in FY 2023 • Average monthly rental rates in excess of $2,800 per unit • Amended Future Phase 2 filings with builders to add 19 additional rentals |
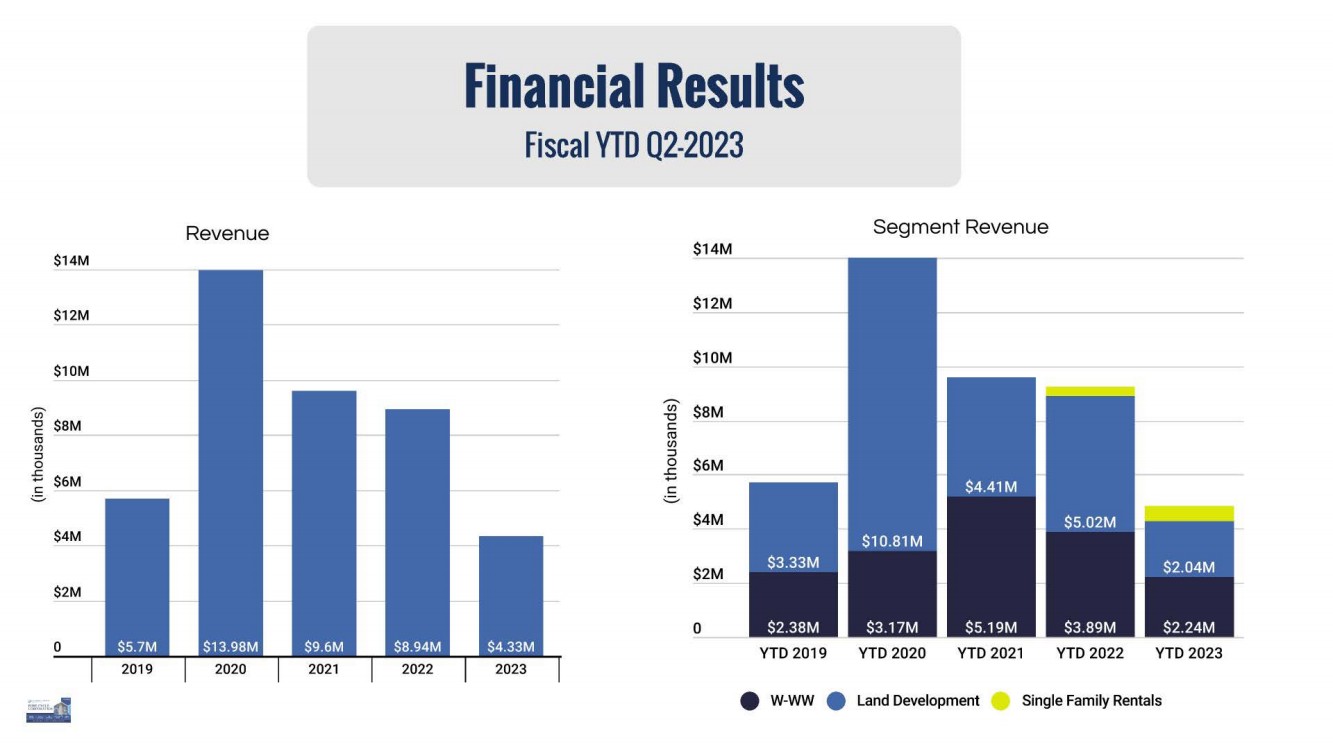
| $14M $12M $10M ,,......_ Cl) ~ $8M ro Cl) :::, 0 ...c - $6M C C, $4M $2M 0 Revenue Financial Results Fiscal YTD 02-2023 Segment Revenue $14M $12M $10M ,......._ en $SM "O C co en ::J 0 $6M .c -C $4.41 M ..;,::, $4M $5.02M $10.81M $2M $3.33M $2.04M 0 $2.38M $3.17M $5.19M $3.89M $2.24M YTD 2019 YTD 2020 YTD 2021 YTD 2022 YTD 2023 • W-WW • Land Development Single Family Rentals |
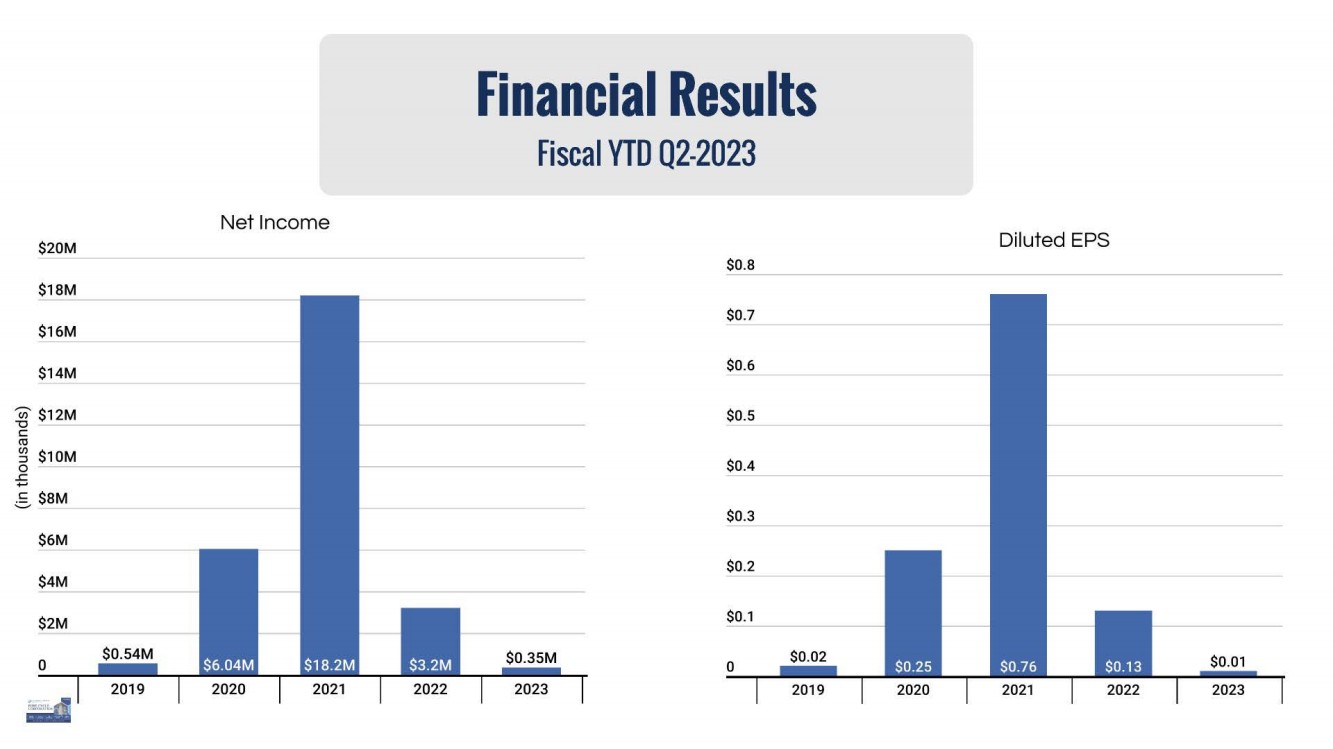
| Financial Results Fiscal VTD 02-2023 Net Income $20M Dilut ed EPS $0.8 $18M $0.7 $ 1 6M $14M $ 0.6 i $ 1 2M $0.5 C ro ~ $10M 0 $0.4 ..s:::. ..... ..S $SM .__, $0.3 $6M $0.2 $4M $2M $0.1 0 $ 0.54M $ 0.35M 0 $ 0 .. 02 $ 0.01 2019 2 0 23 2019 2023 tl~:..d |
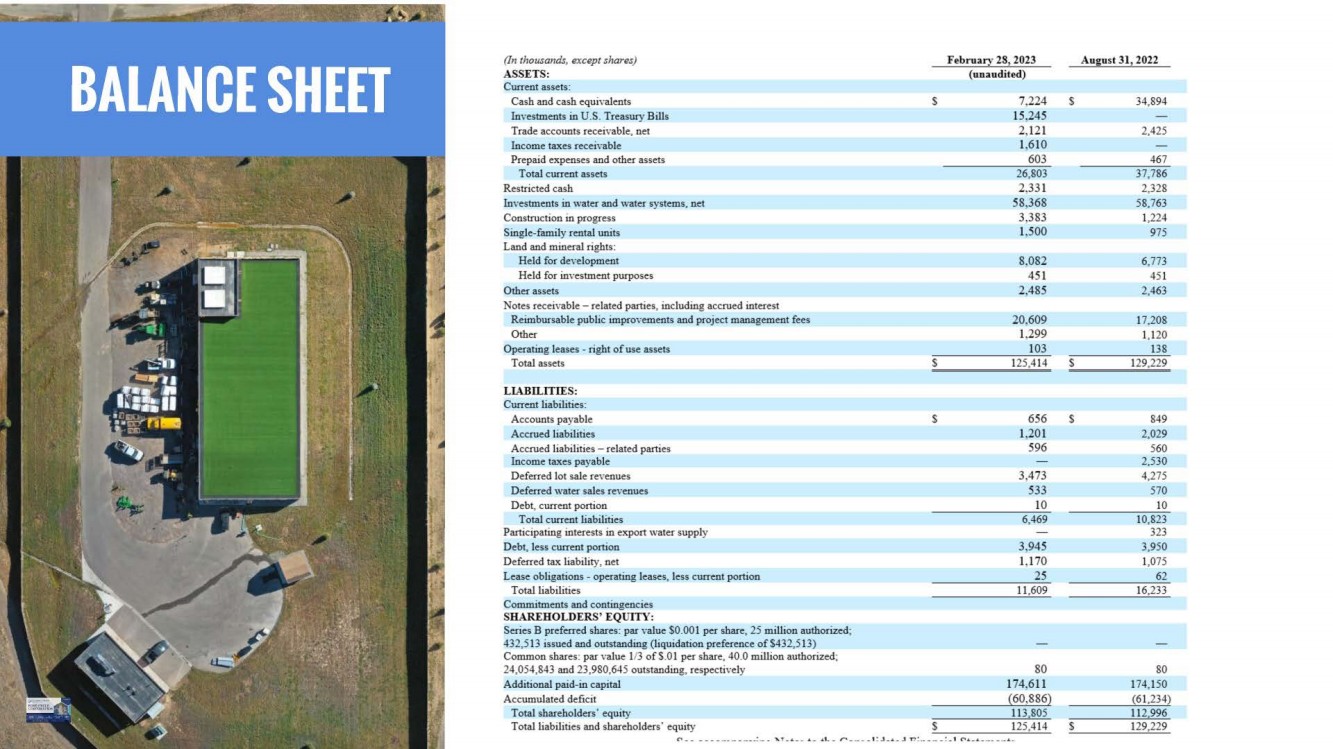
| (In thousands, tZXCllpt sharlls) February 281 2023 August 311 2022 ASSETS: (unaudited) Current assets: Cash and cash equivalents s 7,224 s 34,894 lovestments in U.S. Treasury Bills 15,245 Trade accounts receivable, net 2,121 2,425 locome truces receivable 1,610 Prepaid expenses and other assets 603 467 Total current assets 26,803 37,786 Restricted cash 2,33 1 2,328 lo,·estments in water and water systems, net 58,368 58,763 Construction in progress 3,383 1,224 Single-family rental units 1,500 975 Land and mineral rights: Held for de,·elopment 8,082 6,773 Held for in,·estment purposes 451 451 Other assets 2,485 2,463 Notes receivable - related parties, including accrued interest Reimbursable public impro,·emeots and project management fees 20,609 17,208 Other 1,299 1,120 Operating leases - right of use assets 103 138 Total assets s 125,414 s 129.229 LIABILITIES: Current liabilities: Accounts payable s 656 s 849 Accrued liabilities 1,201 2,029 Accrued liabilities - related parties 596 560 locome truces payable 2,530 Deferred lot sale revenues 3,473 4,275 Deferred water sales revenues 533 570 Debt, current portion 10 10 Total current liabilities 6,469 10,823 Participating interests in export water supply 323 Debt. less current portion 3,945 3,950 Deferred true liability, net 1,170 1,075 Lease obligations - operating leases, less current portion 25 62 Total liabilities 11,609 16,233 Commitments and contingencies SHAREHOLDERS' EQUITY: Series B preferred shares: par value $0.001 per share, 25 million authorized; 432,513 issued and outstanding (liquidation preference of S432,513) Common shares: par value 1/3 of S.O 1 per share, 40.0 million authorized; 24,054,843 and 23,980,645 outstanding, respectively 80 80 Additional paid-in capital 174,611 174,150 Accumulated deficit {60,886} (61,234) Total shareholders· equity 113,805 112,996 Total liabilities and shareholders· equity s 125,414 s 129,229 <"' ...... ----···----·=--, ,. ... .. .... "'- .. t. ... ,... ____ 1 : .J .. .. ... ..1 ""'=··--·=·' eo, . .. ... _. __ .. . |
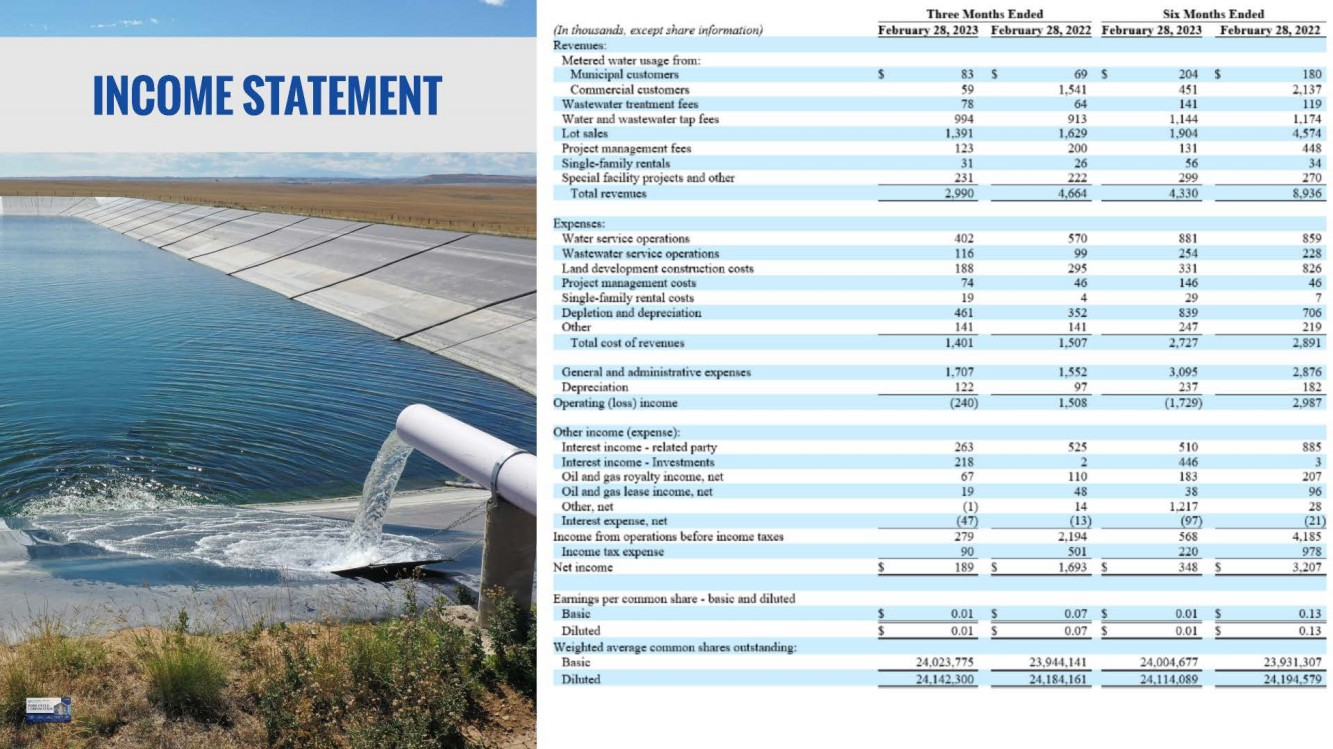
| Thri!t! llonths Ended Six lfontbs Ended (In thousands. e:.-.c~pt share mformano,i) Ftbruary 28, 2023 February 28, 2022 Ftbruan 28, 2023 Februan· 28, 2022 RC'\c:nucs: Metered watc:r ur.aic: &om: INCOME STATEMENT Mumc:ipal c:ustomers $ 83 s 69 s 204 $ 180 Coou11c1"CiaJ customers 59 1.541 45 1 2,137 Wablewnlc:r tn:abuc:ut fc:c:i. 78 64 14 1 119 Watc:1· aud \\Bblewnlc:r tap fees 994 913 1.144 1.174 Lot ~ Jes 1.391 1.629 1.904 '1,574 Project managcruc:nt fc:c-1 123 200 13 1 4<18 Smglc:-fomily rentals 31 26 16 31 Special facility projecti. and other 231 222 299 270 Total r,cvc:nues 2.990 4,664 4.330 8,936 Ex1>c:n1.c:&: Watc:1' scn:icc 01>c:ration& 402 570 881 859 Wa1.tcwater service opcrntions 116 99 254 228 Land development construction costs 188 295 33 1 826 Project JlllUlllgemeut coi.ti, 74 46 146 46 Single-frunily 1-ental costi. 19 4 29 7 Depletion aud depr<!cia11ou 461 351 839 706 Other 141 14 1 247 2 19 Totl'II cost of n:vc.me& 1.401 1.507 2,727 2.891 Ocncral and adminir.trntiYc expense:-. 1.707 1.5~2 3,095 2,876 Ocprcc:i:ition 122 97 237 182 Opcralufi {Ion) 111c:0111c: (240} I.SOS {1,729) 2.987 Other mc:ome (expense): Interest income• related p.1rty 263 525 SlO 885 Interest income • lnYc:stmcnt:5 218 2 446 3 011 and gas royalty income. net 67 110 183 207 Oil and gas lease income. net 19 48 38 96 Other. ue, (1) 14 1.217 28 lnlc:rcst =pcnse, nc:1 {47) ( 13) {97} (21} Income from operations before income ta.xe, 179 2.194 568 4. 185 Income ta.x expense 90 501 110 978 Net income $ 189 s 1,693 $ 348 s 3.207 Earnings per couunou ~h.ru,e • basic and diluted Basic $ 0.01 s 0.07 $ 0.01 s 0.13 Diluted $ 0.01 s 0.07 s 0.01 5 0.13 \Veightcd oYcragc: common shore!! oulst:inding: Baqic 24,023.775 23,914.14 1 24.004.677 23,93 1,307 D1l11tc:d 24.142.300 24 ,18-1. 16 1 24.114,089 2'1 ,1 91 1.H9 |
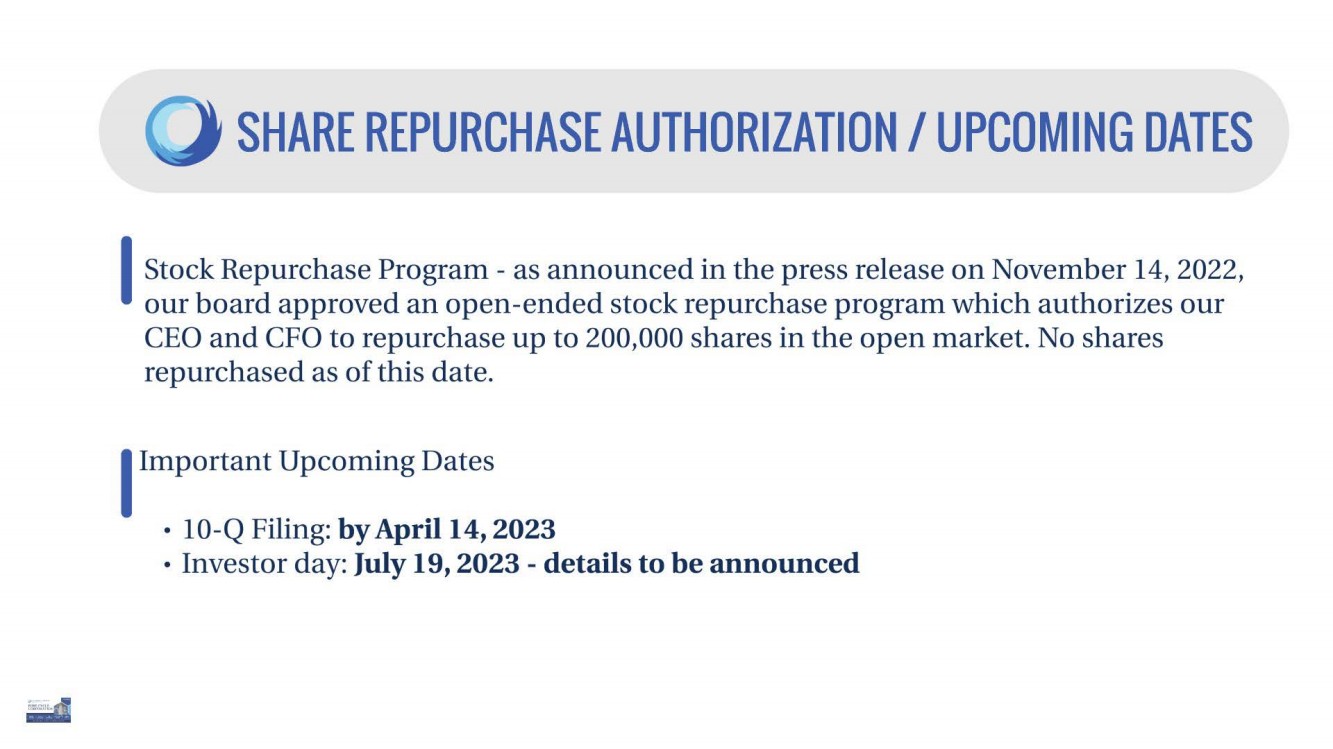
| SHARE REPURCHASE AUTHORIZATION/ UPCOMING DATES I Stock Repurchase Program - as announced in the press release on November 14, 2022, our board approved an open-ended stock repurchase program which authorizes our CEO and CFO to repurchase up to 200,000 shares in the open market. No shares repurchased as of this date. I Important Upcoming Dates • 10-Q Filing: by April 14, 2023 • Investor day: July 19, 2023 - details to be announced |
| Mark W. Harding President and CEO Patrick J. Beirne Chair of the Board Wanda J. Abel Director and Chair of the Nominating and Governance Committee LEADERSHIP AND BOARD OF DIRECTORS Kevin B. McNeill Vice President and CFO Peter C. Howell Director and Chair of the Audit Committee Daniel R. Kozlowski Director and Chair of the Compensation Committee Jeffrey G. Sheets Director Fredrick A. Fendel III. Director |
| CONTACT AND COMPANY INFORMATION CORPORATE HEADQUARTERS 34501 E. Quincy Ave, BLDG 65, Suite A, Watkins, CO 80137 CONTACT INFO info@pu recyclewater. com 303-292-3456 www. pu recyclewater. com Follow us on ... "JI Twitter: @PureCycleCorp ml Linkedln: https://www.linkedin.com/company/pure-cycle-corporation STOCK INFO Ticker symbol (NASDAQ Capital Market): PCYO Shares outstanding: 24.1 million Questions? |
| EARNINGS PRESENTATION FOR THE THREE AND SIX MONTHS ENDED FEBRUARY 28, 2023 - .? ,. · n, ~•wr11::1• - -- ... "I,. lit"' • 7 ------ --- · ➔ ---~ __: .,,,...__ ~ -· - - _, "--.---r: -.. ~ - • • - OS ' 'l ' ~ .. •• ~ -r '' ~ : ' ,,,~-!!tlr:: - ~ ~. ~~~r~~if:--,- " r-. I -r~, • -· - - ..... - ~ ---- -. . "l!!!~u 1 • t .!Z.,.:: : : t rl • ~ :-.. -- ~- •I :• ----~ -=·~~ii ~ -· ---== --.cc:;;===:::-:-- ---- -=- ~ - n ~ .. -- _ r I I ,., ,.. II I·,~· ,s- ~ , ·"-hi , ,.,, ~/! ~··· - -- ~ ·"Fi!" - - - ~, ..... , ,. ~ ~-1; ,,( --- ~ ·_ . ~ Presented by Mark Harding, CEO Kevin McNeil!, CFO Dirk Lashnits, VP Land Development '- ; r9 ~ |
